The probability density function is located in the upper left corner of the distribution overview plot. The probability density function displays the shape of the chosen distribution, and provides the relative chance that the product will fail in any particular interval of time.
When you hold your pointer over the probability density function, Minitab displays a table of failure times and the probability of failure.
Remember that the probability density function is based upon the chosen distribution and is not necessarily the distribution of your data. Use the probability plot to assess how well the distribution fits your data.
Example output
Interpretation
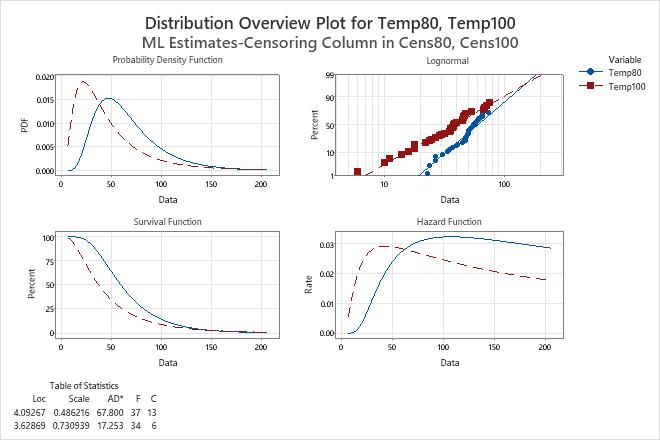
For the engine windings data, the probability density function is based on the lognormal distribution. For the variable Temp80, the lognormal distribution has a location = 4.09267 and scale = 0.486216. For the variable Temp100, the lognormal distribution has a location = 3.62869 and scale = 0.730939.