The hazard function provides a measure of the likelihood of failure as a function of how long a unit has survived. The empirical hazard function always results in an increasing function and therefore it assumes that the likelihood of failure increases as a function of age.
When you do not select a distribution (when you choose to perform a nonparametric analysis), the hazard plot is a step function with steps at the exact failure times.
When you hold your pointer over each step, Minitab displays the hazard rate and failure time.
Example output
Interpretation
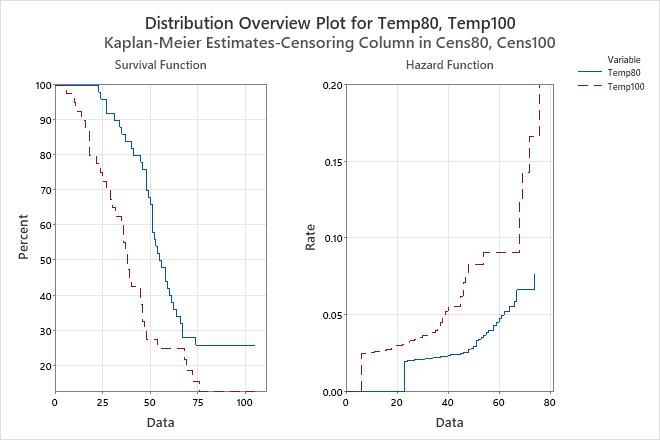
For the engine windings data, a hazard function for each temperature variable is shown on the hazard plot. The hazard function for 100° C shows a greater likelihood of failure for engine windings at all times. At a time of 45 hours, the rate of failure at 100° C is 0.0625 (6.25%), and the rate of failure at 80° C is 0.0250 (2.50)%.