The survival function is located in the lower left corner of the distribution overview plot.
The survival plot depicts the probability that an item will survive until a particular time. Thus, the survival plot shows the reliability of the product over time.
When you hold your pointer over the survival curve, Minitab displays a table of times (or other usage unit, such as miles) and survival probabilities.
Example Output
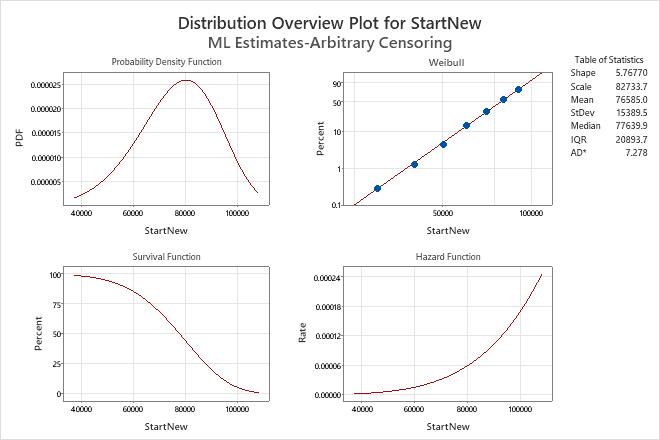
Interpretation
Based on the data for the new mufflers, the probability that the new type of mufflers will survive until 50,000 miles is about 95%. The survival function is based on the Weibull distribution with shape = 5.76770 and scale = 82733.7.