The survival plot depicts the probability that the item will survive until a particular time. Thus, the survival plot shows the reliability of the product over time. The Y-axis displays the probability of survival and the X-axis displays the reliability measurement (such as time, number of copies, miles driven, and so on).
When you do not select a distribution (when you choose to perform a nonparametric analysis), the survival plot is a step function with steps at the end points of each interval. The function is calculated using the Turnbull method.
When you hold your pointer over each step, Minitab displays the probability of surviving (Y) until the plotted time (X).
Example output
Interpretation
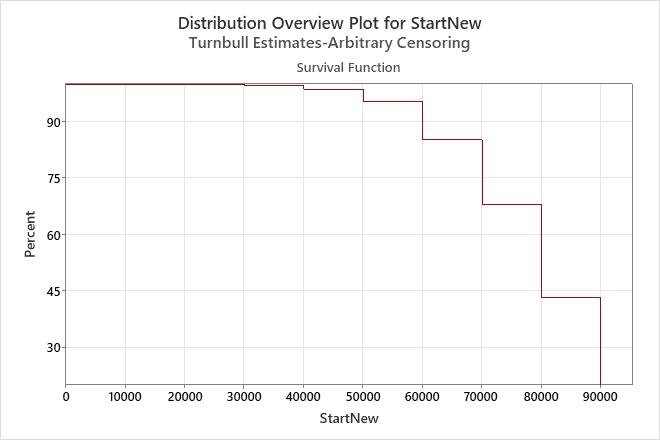
Based on the data for the new mufflers, the probability that the new type of mufflers will survive until 50,000 miles is approximately 0.95. In other words, there is a 95% chance that the mufflers will survive until 50,000 miles.