The probability density function is located in the upper left corner of the distribution overview plot. The probability density function displays the shape of the distribution that you selected, and provides the relative chance that the product will fail in any particular interval of time.
When you hold your pointer over the probability density function, Minitab displays a table of failure times and the probability of failure.
Remember that the probability density function is based on the distribution that you select and is not necessarily the true distribution of your data. Use the probability plot to assess how well the distribution fits your data.
Example output
Interpretation
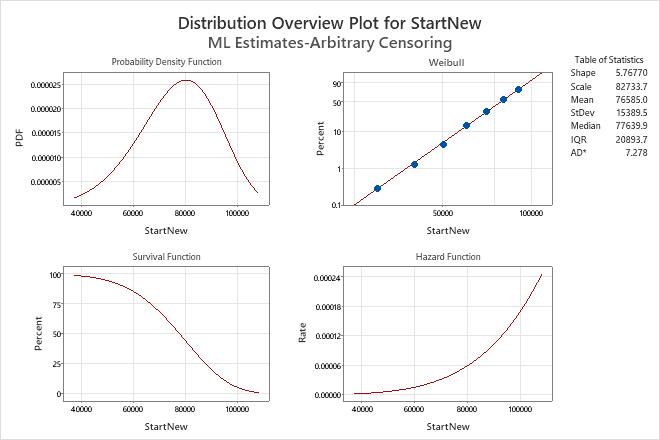
Based on the data for the new type of mufflers, the probability density function is based on the Weibull distribution with shape = 5.76770 and scale = 82733.7.