The hazard function is located in the lower right corner of the distribution overview plot.
The hazard function depicts the likelihood of failure as a function of how long an item has survived (the instantaneous failure rate at a particular time, t). The hazard plot shows the trend in the failure rate over time. You often want to know whether the failure rate of an item is decreasing, constant, or increasing. These patterns can be interpreted as follows.
- Decreasing: Items are less likely to fail as they age. A decreasing hazard indicates that failure typically happens in the early period of a product's life.
- Constant: Items fail at a constant rate. A constant hazard indicates that failure typically happens during the "useful life" of a product when failures occur at random.
- Increasing: Items are more likely to fail as they age. An increasing hazard typically happens in the later stages of a product's life, as in wear-out.
The shape of the hazard function is determined based on the data and the distribution that you selected for the analysis. When you hold your pointer over the hazard curve, Minitab displays a table of failure times and hazard rates.
Example output
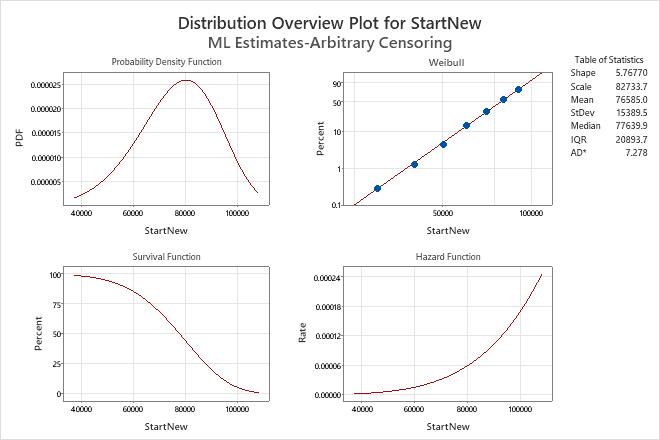
Interpretation
For this data, the hazard function is based on the Weibull distribution with shape = 5.76770 and scale = 82733.7. On this hazard plot, the hazard rate is increasing over time, which means that the new mufflers are more likely to fail as they age.