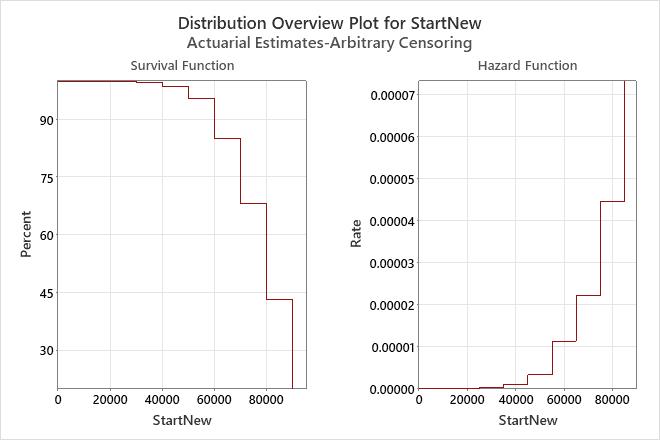
The hazard function provides a measure of the likelihood of failure as a function of how long a unit has survived. The nonparametric hazard plot helps to determine what distribution might be appropriate for modeling these data, if you use parametric estimation methods.
When you do not select a distribution (when you choose to perform a nonparametric analysis), the hazard plot is a step function with steps at the midpoints of each interval. The function is calculated using the actuarial estimation method.
When you hold your pointer over each step, Minitab displays the hazard rate (Y) at each failure time (X).
Example output
Interpretation
Based on the data for the new mufflers, the hazard function is increasing. Therefore, if a parametric method is used, the data should be modeled by a distribution that has an increasing hazard function.