A reliability engineer wants to assess the reliability of a new type of muffler and to estimate the proportion of warranty claims that can be expected with a 50,000-mile warranty. The engineer collects failure data on both the old type and the new type of mufflers. Mufflers were inspected for failure every 10,000 miles.
The engineer records the number of failures for each 10,000-mile interval. Therefore, the data are interval censored. Before analyzing the failure data for the new mufflers using Parametric Distribution Analysis, the engineer uses Distribution ID Plot to select a distribution model for the analysis.
- Open the sample data, MufflerReliability.MWX.
- Choose .
- From Censoring, select Interval censored data.
- From Data, select One or more samples, each in separate start and end columns.
- In Start column, enter StartNew.
- In End column, enter EndNew.
- In Frequency column (optional), enter FreqNew.
-
Deselect Location scale distributions and Distributions with a threshold parameter to assess the following distributions:
- Weibull
- Lognormal
- Loglogistic
- Exponential
- Select OK.
Interpret the results
On the Weibull probability plot, the points fall approximately on the straight line. Therefore, the Weibull distribution provides a good fit. The engineer thus decides to use the Weibull distribution to model the data for Parametric Distribution Analysis.
Minitab also displays a table of percentiles and a table of mean time to failure (MTTF), which provide calculated failure times for each distribution. You can compare the calculated values to see how your conclusions may change with different distributions. If several distributions fit your data well, you may want to use the distribution that provides the most conservative results.
Tip
The analysis stores a reliability data definition that includes the sample columns and the censoring scheme. Select the definition to quickly run Distribution ID Plot, Distribution Overview Plot, Parametric Distribution Analysis, and Nonparametric Distribution Analysis on the same data.
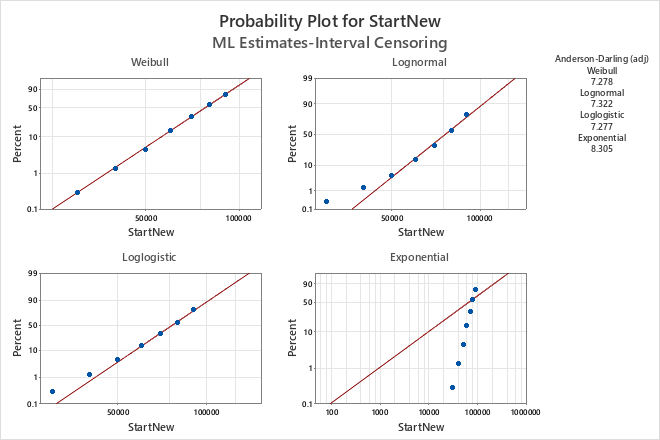
Goodness-of-Fit
| Distribution | Anderson-Darling (adj) |
|---|---|
| Weibull | 7.278 |
| Lognormal | 7.322 |
| Loglogistic | 7.277 |
| Exponential | 8.305 |
Table of Percentiles
| Standard Error | 95% Normal CI | ||||
|---|---|---|---|---|---|
| Distribution | Percent | Percentile | Lower | Upper | |
| Weibull | 1 | 37265.1 | 938.485 | 35470.3 | 39150.6 |
| Lognormal | 1 | 43817.7 | 688.033 | 42489.7 | 45187.2 |
| Loglogistic | 1 | 41843.3 | 810.048 | 40285.4 | 43461.5 |
| Exponential | 1 | 941.789 | 32.5296 | 880.143 | 1007.75 |
| Weibull | 5 | 49434.9 | 841.147 | 47813.5 | 51111.3 |
| Lognormal | 5 | 51458.9 | 624.451 | 50249.5 | 52697.5 |
| Loglogistic | 5 | 51967.9 | 703.264 | 50607.7 | 53364.8 |
| Exponential | 5 | 4806.55 | 166.019 | 4491.93 | 5143.21 |
| Weibull | 10 | 56006.1 | 759.186 | 54537.7 | 57514.0 |
| Lognormal | 10 | 56063.1 | 585.905 | 54926.4 | 57223.3 |
| Loglogistic | 10 | 57323.9 | 638.684 | 56085.7 | 58589.5 |
| Exponential | 10 | 9873.05 | 341.017 | 9226.79 | 10564.6 |
| Weibull | 50 | 77639.9 | 501.312 | 76663.5 | 78628.7 |
| Lognormal | 50 | 75850.3 | 576.625 | 74728.5 | 76988.9 |
| Loglogistic | 50 | 76490.1 | 545.549 | 75428.3 | 77566.9 |
| Exponential | 50 | 64952.9 | 2243.49 | 60701.3 | 69502.3 |
Table of MTTF
| Standard Error | 95% Normal CI | |||
|---|---|---|---|---|
| Distribution | Mean | Lower | Upper | |
| Weibull | 76585.0 | 488.71 | 75633.1 | 77549 |
| Lognormal | 77989.9 | 615.96 | 76792.0 | 79207 |
| Loglogistic | 78702.3 | 579.02 | 77575.6 | 79845 |
| Exponential | 93707.3 | 3236.67 | 87573.5 | 100271 |
