In This Topic
Parameter estimates
Formula
| Distribution | Parameters |
|---|---|
|
Smallest extreme value Normal Logistic |
μ = location, σ = scale, σ > 0 |
|
Lognormal Loglogistic |
μ = location, μ > 0 σ = scale, σ > 0 |
|
3-parameter lognormal 3-parameter loglogistic |
μ = location, μ > 0 σ = scale, σ > 0 λ = threshold. |
|
Weibull |
α = scale, α = exp(μ) β = shape, β = 1/σ |
|
3-parameter Weibull |
α = scale, α = exp(μ) β = shape, β = 1/σ λ = threshold, |
|
Exponential |
θ = scale, θ > 0 |
|
2-parameter exponential |
θ = scale, θ > 0 λ = threshold, |


Standard error of parameter estimates
The standard error is the standard deviation of the estimate of the parameter. The standard error provides a measure of the variability in each estimate.
 ,
,  ,
,  ,
,  ,
,  , and
, and  denote the standard error of the MLE of μ, σ, α, β, θ, and λ. Each standard error is calculated as the square root of the appropriate diagonal element of the inverse of the Fisher information matrix.
Confidence limits for parameter estimates
Formula
| Distribution | Parameter | Lower confidence limit | Upper Confidence limit |
|---|---|---|---|
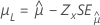
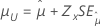
| Smallest extreme value, normal, logistic, lognormal, loglogistic | Location, μ |
 |
 |
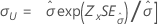
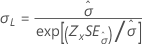
| Scale, σ |
 |
 |
|
| 3-parameter lognormal, 3-parameter loglogistic | Location, μ |
 |
 |
| Scale, σ |
 |
 |
|
| Threshold, λ |
 |
 |
|
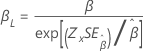
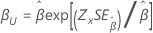
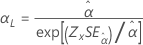
| Weibull | Shape, β |
 |
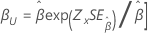 |
| Scale, α |
 |
 |
|
|
3-parameter Weibull |
Shape, β |
 |
 |
|
Scale, α |
 |
 |
|
|
Threshold, λ |
 |
 |
|
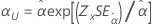
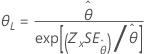
| Exponential | Scale |
 |
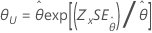 |
| 2-parameter exponential | Scale, θ |
 |
 |
| Threshold, λ |
 |
 |
Note
For some data, the likelihood function is unbounded and, therefore, yields inconsistent estimates for distributions with a threshold parameter (such as the 2-parameter exponential). When this happens, the variance-covariance matrix of the estimated parameters cannot be determined numerically. In that case, Minitab assumes that  is fixed, resulting in SE (
 ) = 0. The upper and lower bound for
  is
is  .
.
Notation
| Term | Description |
|---|---|
| zx | the  upper critical value for the standard normal distribution where 100x % is the confidence level and 0 < x < 1. upper critical value for the standard normal distribution where 100x % is the confidence level and 0 < x < 1. |