Use the POP (probability of passing) graph to ensure that a demonstration test has a reasonable chance of passing when a part has truly improved. The probability of passing graph plots the probability of passing a demonstration test against the amount of improvement.
You can also use the POP graph to compare multiple test plans. Choose the more powerful (higher POP) m-failure test plans.
Example output
Interpretation
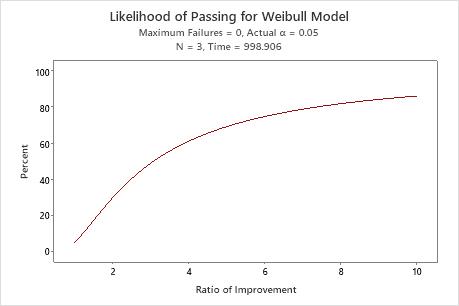
The probability that the 0-failure test will pass increases steadily as the improvement ratio increases from zero to ten. However, even with an improvement ratio as high as ten, the test has just over an 80% chance of passing.
If the (unknown) true scale parameter were 4000, then the improvement ratio = 4000/1000 = 4, and the probability of passing the test would be around 61%.
Because the likelihood of passing this demonstration test is not that high, even with a reasonably large improvement ratio, you may want to consider increasing the sample size or increasing the maximum number of allowable failures.