Engineers determine that early transmission failures occurring on a track-type tractor are due to the failure of a ball bearing. The failure times for this ball bearing follow a Weibull distribution with a shape of 1.3 and scale of 1,000 hours. The engineers have 3 redesigned units available for testing and must determine how long to test each unit using a 0-failure test plan.
- Choose .
- Under Minimum Value to be Demonstrated, select Scale (Weibull or expo) or location (other dists), and enter 1000.
- In Maximum number of failures allowed, enter 0.
- Select Sample sizes and enter 3.
- Under Distribution Assumptions, in Distribution, select Weibull. In Shape (Weibull) or scale (other distributions), enter 1.3.
- Click OK.
Interpret the results
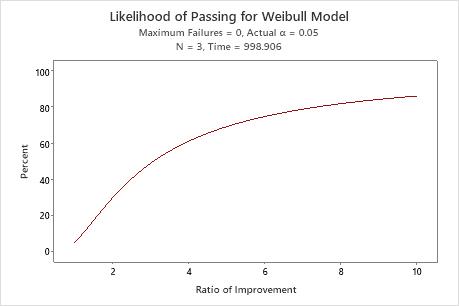
At a 95% level of confidence, the testing time required to demonstrate that the scale of the new system exceeds 1000 hours is 998.906 hours.
The probability of passing graph shows that the probability that the 0-failure test will pass increases steadily as the ratio of improvement increases from 0 to 10. However, even at a ratio as high as 10, the test has just over an 80% chance of passing.
If the (unknown) true scale parameter were 4000, then the ratio of improvement = 4000/1000 = 4, and the test has a probability of passing of approximately 61%.
Because the likelihood of passing this demonstration test is not very high, even when the ratio of improvement is fairly high, the engineers may want to increase the sample size, or increase the maximum number of allowable failures.
Test Plans
| Failure Test | Sample Size | Testing Time |
|---|---|---|
| 0 | 3 | 998.906 |