 for
for  represent the observed data. This representation uses the following
definitions:
represent the observed data. This representation uses the following
definitions:| Term | Description |
|---|---|
 | the time on study for the ith sample unit or individual |
 | an indicator for if subject
i is censored, such that  if subject
i experienced the event and
if subject
i experienced the event and  otherwise
 |
 | a p-component vector of predictors for the ith individual, which is equivalent to the ith row of the design matrix |
 ,
the values of the predictors are known at the beginning of the study do not
change over the course of the study. These fixed values of the predictors do
not depend on the point in time of the study. Minitab excludes any rows with
the following characteristics from the calculations:
,
the values of the predictors are known at the beginning of the study do not
change over the course of the study. These fixed values of the predictors do
not depend on the point in time of the study. Minitab excludes any rows with
the following characteristics from the calculations:
- Rows with missing values
- Rows where the event time is 0
- Rows with negative event times
- Rows where the event time equals the entry time
The Cox proportional hazards model
 for an individual
i with the vector of predictor values
for an individual
i with the vector of predictor values
 .
The equation has the following form:
.
The equation has the following form: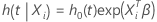
where  is the baseline hazard rate that characterizes the unspecified distribution of
survival time and
is the baseline hazard rate that characterizes the unspecified distribution of
survival time and  is an unknown
p-component vector for the effects of the predictors. The Cox
proportional hazards model does not make an assumption about the distribution
of the baseline hazard rate.
is an unknown
p-component vector for the effects of the predictors. The Cox
proportional hazards model does not make an assumption about the distribution
of the baseline hazard rate.

where  represents the different strata. This specification assumes that the regression
coefficients are the same across strata. This assumption is equivalent to the
statement that the slopes are constant. The baseline hazards function can
change among strata.
represents the different strata. This specification assumes that the regression
coefficients are the same across strata. This assumption is equivalent to the
statement that the slopes are constant. The baseline hazards function can
change among strata.
Censoring
In reliability analysis, failure data frequently contain individual times to failure. For example, you might collect times to failure for units operating at a particular temperature. You might also collect samples of times to failure under different temperatures, or under different combinations of stress variables.
Sometimes you record exact times to failure. Other times, the exact times to failure of some test units are unknown. In this case, the data are called censored. Failure data are often censored in some way. In Minitab Statistical Software, the Cox proportional hazards model takes into account rows where the event does not occur by the last observation of the unit or subject. These rows are right-censored.
Left truncation
Left truncation is when observations of potential subjects of a study do not
take place at the origin of the study but the subject enters the study at a
specific later time. This later time is the entry time. For example, a patient
on a waiting list for an organ transplant does not enter a study until the
patient receives an organ. The risk set
R(t) for an event time
t is the set of all subjects that satisfy the expression
 where
where  and
and  are the subject delayed entry time and the subject entry time, respectively.
The risk set for an event time does not include subjects whose entry times are
greater than the event time.
are the subject delayed entry time and the subject entry time, respectively.
The risk set for an event time does not include subjects whose entry times are
greater than the event time.
- Untruncated and right-censored
- Left truncated and right-censored
- Untruncated and uncensored
Left truncation is different from left censoring. A subject event time is left-censored if the event takes place before any observation of the subject. With left-censored data, the observed time is larger than the event time. Minitab Statistical Software excludes left-censored data from Cox regression analyses.
Correlated observations and the robust covariance estimator
In some models, the design correlates subgroups of observations. For
example, the subject observations are correlated in models that include
repeated or recurrent events. Lin and Wei (1989)1 propose an adjustment of the covariance matrix to account for the
correlation among within-subject observations. Let
 be the matrix of score residuals. Then, the robust variance covariance matrix
has the following form:
be the matrix of score residuals. Then, the robust variance covariance matrix
has the following form:
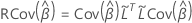
where  and
and  is the collapsed score residual matrix. To obtain the collapsed score residual
matrix, replace each cluster of score residual rows by the sum of those
residual rows.
is the collapsed score residual matrix. To obtain the collapsed score residual
matrix, replace each cluster of score residual rows by the sum of those
residual rows.
- Calculations for inferences use the robust variance-covariance matrix.
- The Wald and Score tests in the Goodness-of-Fit table use the robust variance-covariance matrix. The likelihood ratio test in the Goodness-of-Fit table is missing because the likelihood ratio test assumes that the observations within a cluster are independent.
- The ANOVA table can use only the Wald test.