In This Topic
The Andersen plot and the Arjas plot assess whether the proportional hazards assumption is appropriate for the data.
Andersen plot
Andersen plots assess the appropriateness of the proportional hazards assumption for models that include stratification. The Andersen plot displays the estimated baseline cumulative hazard rate for the first stratum against the baseline cumulative hazard rates for the other strata. For details on the calculation of the baseline cumulative hazard rate, go to Methods and formulas for the survival function in Fit Cox Model with Fixed Predictors only.
Arjas plot
Suppose that you have a Cox proportional hazards model with
p predictors,  .
You can use an Arjas plot to determine whether to include a categorical
predictor,
.
You can use an Arjas plot to determine whether to include a categorical
predictor,  ,
in the model. You can also check whether the proportional hazards assumption
holds for predictor
,
in the model. You can also check whether the proportional hazards assumption
holds for predictor  .
.
Suppose that  has
has  levels and that
C(k) is the set of subjects in the grouping level
k for predictor
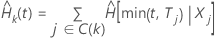
X, k = 1,…,K. The Arjas plot displays the total time on test of
the estimated cumulative hazard rates up to time
t,
levels and that
C(k) is the set of subjects in the grouping level
k for predictor
X, k = 1,…,K. The Arjas plot displays the total time on test of
the estimated cumulative hazard rates up to time
t,  ,
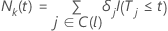
against the cumulative number of observed events up to time
t,
,
against the cumulative number of observed events up to time
t,  .
For further descriptions of Arjas plots, see Arjas (1988)1
or Klein and Moeschberger (2003)2.
.
For further descriptions of Arjas plots, see Arjas (1988)1
or Klein and Moeschberger (2003)2.

where  is a
p-component vector of covariates for subject
j and
is a
p-component vector of covariates for subject
j and  is the estimated baseline cumulative hazard rate. For details on the
calculation of the baseline cumulative hazard rate, go to
Methods and formulas for the survival function in Fit Cox Model with Fixed Predictors only.
The calculations for
is the estimated baseline cumulative hazard rate. For details on the
calculation of the baseline cumulative hazard rate, go to
Methods and formulas for the survival function in Fit Cox Model with Fixed Predictors only.
The calculations for  and
and  depend on whether the model has stratification.
Calculations without stratification
| Term | Description |
|---|---|
 | the response time for subject j |
 | an indicator for censoring where  if the event happens and
  if the
jth response time is right censored.
if the
jth response time is right censored. |
 | an indicator for the event where  if
if  and 0 otherwise
 |
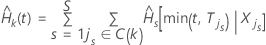
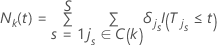
Calculations with stratification
| Term | Description |
|---|---|
 | the estimated cumulative hazard function for stratum s |
 | the jth individual in stratum s |
 | the response time for subject j in stratum s |
 | an indicator for censoring where  if the event happens and
  if the
jth response time in stratum
s is right censored.
if the
jth response time in stratum
s is right censored. |
 | an indicator for the event where  if
if  and 0 otherwise
 |