In This Topic
The goodness-of-fit tests assess the null hypothesis
 against the alternative hypothesis
  .
For the tests,
.
For the tests,  is a
p-component vector.
is a
p-component vector.
- Global Wald tests
- Global likelihood ratio tests
- Global score tests
In an analysis with clusters, Minitab does not provide the global likelihood ratio tests because the test assumes that observations within clusters are independent.
DF
The degrees of freedom for the goodness-of-fit tests are the sum of the degrees of freedom for the terms in the model. This sum equals the number of parameters in the model.
Chi-square
The calculation of the chi-square statistic depends on the test. When the response variable has no tied response times, then the score test is identical to the well-known log-rank test.
Under the null hypothesis, the test statistic for each type of test has an asymptotic chi-square distribution. The asymptotic distribution is valid when the number of observed events is large compared to the number of parameters in the model. For categorical predictors, the number of events in each level must also be large enough.
Likelihood ratio test
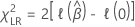
where  is the appropriate model partial log-likelihood function.
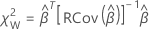
Wald test

where  is the Fisher information matrix.
 be the matrix of score residuals. Then, the robust variance covariance matrix
has the following form:
be the matrix of score residuals. Then, the robust variance covariance matrix
has the following form:
where  and
and  is the collapsed score residual matrix. To obtain the collapsed score residual
matrix, replace each cluster of score residual rows by the sum of those
residual rows.
is the collapsed score residual matrix. To obtain the collapsed score residual
matrix, replace each cluster of score residual rows by the sum of those
residual rows.
Score test

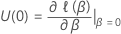

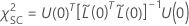
where  is the collapsed score residual matrix for
  .
To obtain the collapsed score residual matrix, replace each cluster of score
residual rows by the sum of those residual rows.
.
To obtain the collapsed score residual matrix, replace each cluster of score
residual rows by the sum of those residual rows.
P-value
where  is a random variable that follows a chi-square distribution with
 degrees of freedom.
  is the test statistic.