In This Topic
The analysis of variance provides a test of the statistical significance for each predictor in the model.
DF
The Degrees of Freedom (DF) for a predictor depend on whether the predictor is categorical or continuous. For a categorical predictor, the degrees of freedom are 1 less than the number of levels, k, in the predictor (k – 1). For a continuous predictor, the degrees of freedom are always 1. For a higher-order term, the degrees of freedom are the product of the degrees of freedom in the composite terms. For example, the degrees of freedom for the interaction between two 3-level categorical predictors is 2 × 2 = 4.
Chi-square
- Wald tests
- Likelihood ratio tests
- Score tests
If clusters are present in the design, then Minitab provides the ANOVA table based on the Wald test because the likelihood ratio and score methods assume that observations within clusters are independent.
When the response variable has no tied response times, then the score test is identical to the well-known log-rank test.
Definitions
The calculations for all 3 types of tests use the following definitions.
Let  be the Breslow partial likelhood function or the Efron partial likelihood
function evaluated at
β.
be the Breslow partial likelhood function or the Efron partial likelihood
function evaluated at
β.
Let  be a
q-component vector and
be a
q-component vector and  be a (p –
q)-component vector so that the 2 p-component coefficient vectors
have the following definitions:
be a (p –
q)-component vector so that the 2 p-component coefficient vectors
have the following definitions:  and
and  .
.


Let  be the (partial) maximum likelihood of
  under the restricted model where
  .
Then the maximum likelihood estimate under the null hypothesis has the
following form:
.
Then the maximum likelihood estimate under the null hypothesis has the
following form:
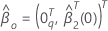
where  is a
q-component vector of zeroes and
is a
q-component vector of zeroes and  is the (partial) maximum likelihood of
  when
when  .
.

 is the following
q ×
q matrix:
is the following
q ×
q matrix:
 is the following
p –
q ×
p –
q matrix:
is the following
p –
q ×
p –
q matrix:
 and
and  have the following definition:
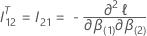
Under the null hypothesis, the test statistic for each of the three tests (Wald, likelihood ratio, and score tests) has an asymptotic chi-square distribution with q degrees of freedom. The asymptotic distribution is valid when the number of observed events is large compared to the number of parameters in the model. For categorical predictors, the number of events in each level must also be large enough.
Wald tests
For the Wald test, the test statistic has the following form:
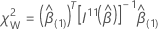
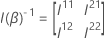
where  is the upper
q ×
q submatrix of
is the upper
q ×
q submatrix of  .
.
If the design has clusters, the calculations make use of the robust
variance from Lin & Wei (1989)1. Let  be the matrix of score residuals. Then, the robust variance covariance matrix
has the following form:
be the matrix of score residuals. Then, the robust variance covariance matrix
has the following form:
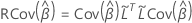
where  and
and  is the collapsed score residual matrix. To obtain the collapsed score residual
matrix, replace each cluster of score residual rows by the sum of those
residual rows.
is the collapsed score residual matrix. To obtain the collapsed score residual
matrix, replace each cluster of score residual rows by the sum of those
residual rows.
Likelihood ratio tests
For the likelihood ratio test, the test statistic has the following form:
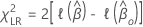
where  is the appropriate model partial log-likelihood function.
If clusters are present in the design, then Minitab provides the ANOVA table based on the Wald test because the likelihood ratio and score methods assume that observations within clusters are independent.
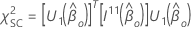
Score tests
Let  be the vector of partial derivatives of the log-likelihood function with
respect to
be the vector of partial derivatives of the log-likelihood function with
respect to  .
Specifically, this
q-component vector has the following form:
.
Specifically, this
q-component vector has the following form:

Then the test statistic for the score test has the following form:
If clusters are present in the design, then Minitab provides the ANOVA table based on the Wald test because the likelihood ratio and score methods assume that observations within clusters are independent.
P-value
The p-value has the following form:
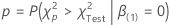
where  is a random variable that follows a chi-square distribution with
 degrees of freedom.
  is the test statistic.