The survival plot displays the probability that a unit survives until a particular time. When you hold your pointer over the bottom point of a jump in the curve, Minitab displays the X- and Y-coordinate for that point.
Use the survival plot only when the model fits the data well. If the model fits the data poorly, then the estimates can be inaccurate. Use the goodness-of-fit tests, model summary statistics, and the graphical and analytical tests of the proportional hazards assumption to assess how well the model fits the data.
Interpretation
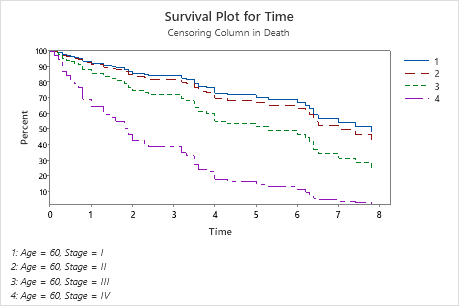
Use a plot with a single curve to assess the probability of survival over time for the function on the plot. Use a plot with multiple curves to compare the probability of survival for different settings of the predictors. The survival plot for a model with strata displays separate curves for each stratum.
For example, this survival plot displays the survival probability for a 60 year old for each stage of cancer over multiple years. A diagnosis of stage IV cancer has the greatest affect on survival probability. The plot shows that after 1 year a 60 year old with stage IV cancer has only a 64% chance of surviving. The other three stages have a probability of 85% or higher. After 2 years, the probability drops to 42% for a patient with stage IV, but remains at 74% or higher for the other three stages.