The plot of the deviance residuals versus the risk scores plots the
residuals on the y-axis and the risk scores on the x-axis.
Use the plot of the deviance residuals versus the risk scores to look for
points that the model does not fit well. Ideally, the points fall randomly on
both sides of 0. Unusual points are usually outliers or influential points.
- Outlier
- A point with a deviance residual far from the other residuals on the y-axis.
- Influential point
- A point with a risk score that is far from the other residuals on the x-axis.
A plot that shows too many outliers can indicate that the model performs poorly. Try to identify the causes of outliers and influential points. Correct any data entry or measurement errors that you find. Consider the removal of data that are associated with abnormal, one-time events. Then, repeat the analysis.
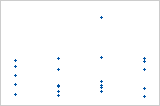
Plot with outlier
One of the points is much larger than all of the other points. Therefore, the point is an outlier.