Arjas plots show the cumulative hazard rate against the cumulative
number of events for each level of a categorical variable.
Interpretation
Use the Arjas plot to determine whether the model meets the proportional hazards assumption for a categorical predictor. If the curves on the plot differ from the 45 degree line, then the model does not meet the proportional hazards assumption for the predictor.
If the model does not meet the assumption, consider whether to use the predictor as a stratification variable instead.
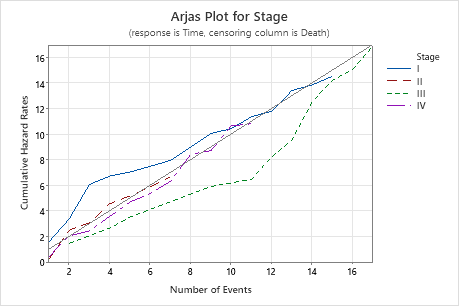
Arjas Plot
The Arjas plot displays the cumulative hazard rates versus the number of events for each level of Stage. In this Arjas plot, the lines generally follow the 45 degree line, so you can conclude that the model meets the proportional hazards assumption for the predictor Stage.