- The baseline hazard rate for the stratum is the same as the baseline hazard rate for the stratum on the x-axis.
- The model meets the proportional hazards assumption.
Interpretation
Use the Andersen plot to assess whether the model meets the proportional hazards assumption across the strata. While each stratum has its own baseline hazard rate, the proportional hazards assumption means that the effects of the predictors remain the same across strata.
- If the model meets the assumption, the curves are straight lines through the origin. If the variables do not need to be in the model, then the curves follow the reference line.
- If the model does not meet the assumption, then the model fit can be inadequate. You can consider whether to build a separate model for each stratum so that in addition to the different baseline hazard rates, the models also have different values for the coefficients of the predictors.
If the model does not meet the assumption, then the shape of the curve provides information about the relationship between the hazard function on the y-axis and the hazard function on the x-axis. A concave curve is flat and then increases more rapidly. A concave curve indicates that the ratio of the hazard functions decreases with time. A convex curve increases rapidly and then flattens. A convex curve indicates that the ratio of the hazard functions increases with time.
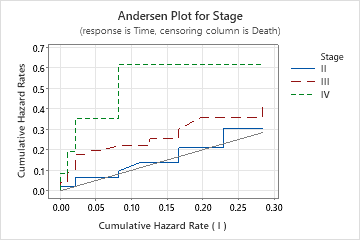
Andersen plot
For example, in this plot the x-axis is the hazard rate for patients who receive treatment during the first phase of a disease, stage I. The curve for stage II shows the hazard function for patients who receive treatment during the second phase of a disease. The curve for stage II follows the reference line, which suggests that stages I and II have the similar baseline hazard rates. Consider whether to use a model that does not distinguish between these stages.
The curve for stage III approximately follows a straight line. The curve for stage III does not follow not the reference line. The hazards between stage I, II, and III are proportional. The baseline hazard rate for stage III is different from the baseline hazard rate for stage I and II.
The curve for stage IV is convex--the curve first increases and then flattens. The model does not meet the proportional hazards assumption for stage IV. The effects of other predictors in the model differ between stage IV and the other stages. Because the shape of the curve is convex, the ratio of the two hazard functions increases with time. Patients who do not receive treatment until stage IV of the disease are more at risk over time. To get an adequate fit, consider whether to fit a separate model for stage IV.