Medical researchers want to determine whether the stage of larynx cancer affects the chance of death. The researchers plan to adjust the analysis for a patient's age. The researchers record the stage and age of 90 male cancer patients. Then, the researchers record the number of years between the first treatment and either the patient's death or the end of the study. Finally, the researchers record whether the patient died.
The medical researchers perform Cox regression to evaluate the relationship between death, age, and the stage of the cancer. The researchers also want to estimate the survival probability for a 60-year-old man for each stage.
Note
These data were adapted based on a public data set from Kardaun that can be found in Klein and Moeschberger (2003)1. However, the results in this example do not match the textbook because the textbook uses the Breslow method for handling ties and this example uses the Efron method.
- Open the sample data, LarynxCancer.MWX.
- Choose .
- In Response, enter Time.
- In Censoring column (optional), enter Death.
- In Continuous predictors, enter Age.
- In Categorical predictors, enter Stage.
- Select Graphs and check Display survival plot for predictor values.
- From the drop down, select Enter
individual values. Enter the following values in the table.
Age Stage 60 I 60 II 60 III 60 IV - Select OK in each dialog box.
Interpret the results
First, the researchers use the goodness-of-fit tests to evaluate the overall fit of the model. The p-values for all 3 tests are below 0.05, so the researchers conclude that the model fits the data well. Then the researchers use the ANOVA table to evaluate the effect of individual terms. The p-value for stage is significant at an α-level of 0.05. Therefore, the medical researchers conclude that the stage of the cancer has a statistically significant effect on the survival of the patient. However, the p-value for age is 0.182, so the effect of age is not significant at an α-level of 0.05. The coefficients for the predictors define an equation that describes the relationship between the stage, the age of the patient, and the survival time.
The researchers use the Relative Risks for Categorical Predictors table to assess the risk between different stages of cancer. For example, the risk of death among patients at stage IV is 5.5 times higher than the risk for patients in Stage I. Moreover, the confidence interval shows that the true risk of death for patients in Stage IV could be as little as 2.4 times or as much as 12.6 times more than the risk for patients at Stage I, at the 95 percent level of confidence. The confidence interval does not contain 1, so the difference between the risk of death for Stage I and Stage IV is statistically significant.
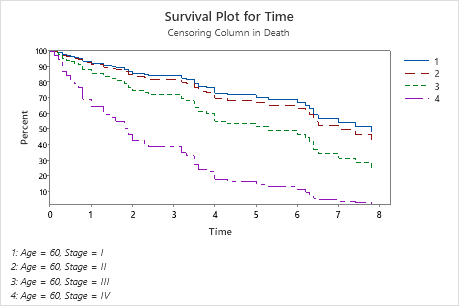
The survival plot displays the survival probability for a 60-year-old man for each stage of cancer over multiple years. A diagnosis of stage IV cancer has the greatest affect on survival probability. The plot shows that after 1 year a 60 year old with stage IV cancer has only a 64% chance of surviving. The other three stages have a probability of 85% or higher. After 2 years, the probability drops to 42% for a patient with stage IV, but remains at 74% or higher for the other three stages.
Method
| Cox model type | Fixed predictors only |
|---|---|
| Categorical predictor coding | (1, 0) |
| Tie adjustment | Efron |
Censoring Information
| Uncensored Units | Censored Units | Total | Percent Censored |
|---|---|---|---|
| 50 | 40 | 90 | 44.44% |
Regression Equation
| Stage | |||
|---|---|---|---|
| I | Risk Score | = | 0.0 + 0.01903 Age |
| II | Risk Score | = | 0.1400 + 0.01903 Age |
| III | Risk Score | = | 0.6424 + 0.01903 Age |
| IV | Risk Score | = | 1.706 + 0.01903 Age |
Coefficients
| Term | Coef | SE Coef | Z-Value | P-Value |
|---|---|---|---|---|
| Age | 0.0190 | 0.0143 | 1.33 | 0.182 |
| Stage | ||||
| II | 0.140 | 0.462 | 0.30 | 0.762 |
| III | 0.642 | 0.356 | 1.80 | 0.071 |
| IV | 1.706 | 0.422 | 4.04 | 0.000 |
Relative Risks for Continuous Predictors
| Unit of Change | Relative Risk | 95% CI | |
|---|---|---|---|
| Age | 1 | 1.0192 | (0.9911, 1.0481) |
Relative Risks for Categorical Predictors
| Level A | Level B | Relative Risk | 95% CI |
|---|---|---|---|
| Stage | |||
| II | I | 1.1503 | (0.4647, 2.8477) |
| III | I | 1.9010 | (0.9459, 3.8204) |
| IV | I | 5.5068 | (2.4086, 12.5901) |
| III | II | 1.6526 | (0.6819, 4.0049) |
| IV | II | 4.7872 | (1.7825, 12.8566) |
| IV | III | 2.8968 | (1.2952, 6.4788) |
Model Summary
| Model | Log-Likelihood | R-sq | AIC | AICc | BIC |
|---|---|---|---|---|---|
| Without terms | -196.86 | — | 393.73 | 393.73 | 393.73 |
| With terms | -187.71 | 18.65% | 383.41 | 384.30 | 391.06 |
Goodness-of-Fit Tests
| Test | DF | Chi-Square | P-Value |
|---|---|---|---|
| Likelihood Ratio | 4 | 18.31 | 0.001 |
| Wald | 4 | 21.15 | 0.000 |
| Score | 4 | 24.78 | 0.000 |
Analysis of Variance
| Wald Test | |||
|---|---|---|---|
| Source | DF | Chi-Square | P-Value |
| Age | 1 | 1.78 | 0.182 |
| Stage | 3 | 17.92 | 0.000 |