For each subject 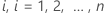 let
let  be the step function that represents the number of events that subject
 experiences up to time
  .
Then
.
Then  represents a counting process for subject
  .
Let
.
Let  be an indicator variable that has the value 1 if subject
i is at risk at time
t and 0 otherwise, which is equivalent to
be an indicator variable that has the value 1 if subject
i is at risk at time
t and 0 otherwise, which is equivalent to
 if
if  and
and  otherwise.
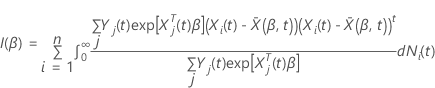
 for an individual
  with a vector of predictor values
  has the following form:
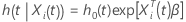
where  is the baseline hazard rate that characterizes the unspecified distribution of
survival time and
is the baseline hazard rate that characterizes the unspecified distribution of
survival time and  is a
p-component vector of unknown regression coefficients.
is a
p-component vector of unknown regression coefficients.
 has the following form:
 has the following form:
- The subject can experience more than one event of interest.
- The subject can experience an
event multiple times. This statement means that the indicator variable that
identifies if the subject is at risk,
 ,
can change states from 1 to 0 and back again multiple times.
,
can change states from 1 to 0 and back again multiple times.
- The subject can enter the study after time 0. This statement is equivalent to the idea that a subject can enter the risk set after time 0. A time is left-truncated when the subject enters after time 0.
The counting process input form
In the counting process input form, multiple rows represent each subject. Each row describes a time interval when the values of all the variables are constant. Time-dependent predictors change between rows. The intervals begin just after the start time and include the end time. The start time for the interval is the entry time for the subject. The end time is the response variable for the subject. The censoring column indicates any row where the end time is not an event time.
Correlated observations and the robust covariance estimator
Although multiple rows represent each subject in the counting process input
form, only one row of the per-subject observations contributes to the
likelihood at each time unless correlation exists among the observations in a
subgroup that pertain to each subject. For example, the subject observations
are correlated in models that include repeated or recurrent events. Lin and Wei
(1989)4 propose an adjustment of the covariance matrix to account for the
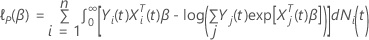
correlation among within-subject observations. Let
 be the matrix of score residuals. Then, the robust variance covariance matrix
has the following form:
be the matrix of score residuals. Then, the robust variance covariance matrix
has the following form:
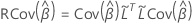
where  and
and  is the collapsed score residual matrix. To obtain the collapsed score residual
matrix, replace each cluster of score residual rows by the sum of those
residual rows.
is the collapsed score residual matrix. To obtain the collapsed score residual
matrix, replace each cluster of score residual rows by the sum of those
residual rows.
- Calculations for inferences use the robust variance-covariance matrix.
- The Wald and Score tests in the Goodness-of-Fit table use the robust variance-covariance matrix. The likelihood ratio test in the Goodness-of-Fit table is missing because the likelihood ratio test assumes that the observations within a cluster are independent.
- The ANOVA table can use only the Wald test.