Regression equation
The semi-parametric Cox proportional hazards model uses the predictor values
for an individual,  ,
to predict the risk score,
,
to predict the risk score,  .
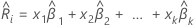
The equation has the following general form:
.
The equation has the following general form:

 is the vector of estimated coefficients. The estimated coefficients can include
values for higher order terms, such as the squares of continuous predictors.
The estimated risk score is valid for the entire period of a study and does not
depend on time. In the output, the equation has the following form where a
separate equation appears for different levels of categorical factors:
is the vector of estimated coefficients. The estimated coefficients can include
values for higher order terms, such as the squares of continuous predictors.
The estimated risk score is valid for the entire period of a study and does not
depend on time. In the output, the equation has the following form where a
separate equation appears for different levels of categorical factors:
Coef
Let the log-partial likelihood function for the Cox proportional hazards
model be  .
The vector that maximizes the partial likelihood function,
.
The vector that maximizes the partial likelihood function,
 ,
gives the estimated coefficients for the model. To find
,
gives the estimated coefficients for the model. To find
 ,
set the partial derivatives of the log-partial likelihood function equal to
zero and solve the equations for
,
set the partial derivatives of the log-partial likelihood function equal to
zero and solve the equations for  .
Minitab Statistical Software uses the Newton-Raphson iteration method to solve
the equations. See Murray (1972)1 for a description of the Newton-Raphson iterative method.
.
Minitab Statistical Software uses the Newton-Raphson iteration method to solve
the equations. See Murray (1972)1 for a description of the Newton-Raphson iterative method.
The vector of partial derivatives of the log-partial likelihood function depends on if the response variable includes tied event times. If the response variable includes ties, then the estimation uses either the Efron approximation or the Breslow approximation. If the response variable has no ties, all 3 methods provide the same estimates. The fewer ties are in the data, the closer the results of of the two approximation methods are. The more ties are in the data, the more the Efron approximation improves on the Breslow approximation.
| Term | Description |
|---|---|
 | the vector of covariate values that corresponds to the sample unit with the
event time  |
Data without ties
| Term | Description |
|---|---|
 | the number of event times |
 | the risk set at time  ,
which is the set of all sample units that have yet to fail prior to time ,
which is the set of all sample units that have yet to fail prior to time
 |
 | a counting variable for the number of parameters in the model,
 where
where  is the number of parameters in the model
 |
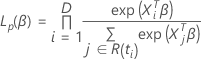
The partial likelihood function for the Cox proportional hazards model with no ties has the following form:
The log-partial likelihood function has the following form:
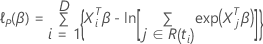
 has the following form:
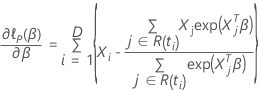
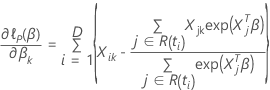
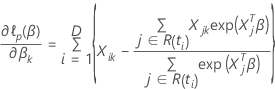
so that the partial derivative for a particular coefficient,
 , has the following form:
Data with ties
| Term | Description |
|---|---|
 | the number of events at time  |
 | the set of all sample units that have the event at time
 |
 | the risk set at time  ,
which is the set of all sample units who have yet to fail prior to time ,
which is the set of all sample units who have yet to fail prior to time
 |

Efron approximation for data with ties
The approximated partial likelihood function has the following form:
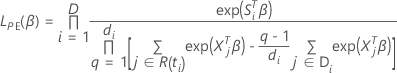
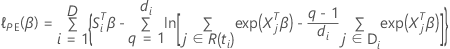
 , has the following form:
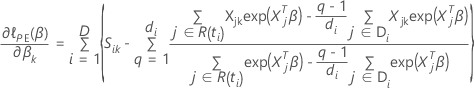
Breslow approximation for data with ties
The approximated partial likelihood function has the following form:
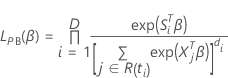
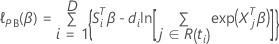
 , has the following form:
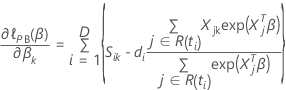
Coded coefficients
The table displays coded coefficients when the analysis standardizes the continuous predictors. To find the coded coefficients, substitute the standardized predictors into the preceding equations.
SE Coef

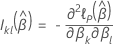
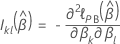
where the observed information matrix,  depends on if the response variable includes tied event times. If the response
variable includes ties, then the estimation uses either the Efron approximation
or the Breslow approximation. If the response variable has no ties, all 3
methods provide the same estimates. The fewer ties are in the data, the closer
the results of of the two approximation methods are. The more ties are in the
data, the more the Efron approximation improves on the Breslow approximation.
depends on if the response variable includes tied event times. If the response
variable includes ties, then the estimation uses either the Efron approximation
or the Breslow approximation. If the response variable has no ties, all 3
methods provide the same estimates. The fewer ties are in the data, the closer
the results of of the two approximation methods are. The more ties are in the
data, the more the Efron approximation improves on the Breslow approximation.
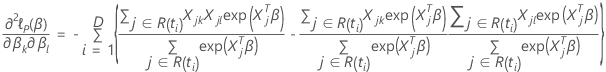
Data without ties
Efron approximation for data with ties
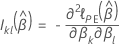
where
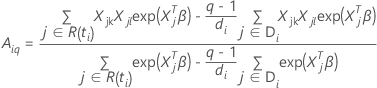
and

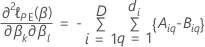
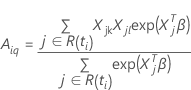
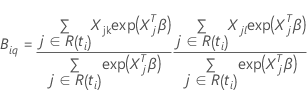
Breslow approximation for data with ties
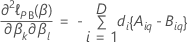
where
and
Z-value


where  is the estimated standard error of the coefficient
 .
The value of
.
The value of  is the positive square root of the
kth diagonal element of
is the positive square root of the
kth diagonal element of  .
.
CI
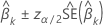
where  is the upper
α percentile point of the standard normal distribution.
is the upper
α percentile point of the standard normal distribution.
P-value
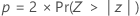
| Term | Description |
|---|---|
 | a random variable that follows the standard normal distribution |
 | the test statistic for the  against the alternative hypothesis
  |
Stratified proportional hazards models
For a model that includes a categorical variable with s levels as a stratification variable, the regression coefficients are constant across strata. The estimation of the regression coefficients in the stratified model has the same process as for the proportional hazards model without stratification. For the stratified model, the log-partial likelihood function has the following form:
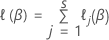
where  is the log partial likelihood within stratum
j. Sum the derivatives across each stratum to obtain the partial
likelihood equations. The derivatives across each stratum are the same as the
derivatives for the proportional hazards model without stratification. The
Breslow and Efron methods apply accordingly.
is the log partial likelihood within stratum
j. Sum the derivatives across each stratum to obtain the partial
likelihood equations. The derivatives across each stratum are the same as the
derivatives for the proportional hazards model without stratification. The
Breslow and Efron methods apply accordingly.