Use the plot of the Martingale residuals versus a variable to determine the functional form of a continuous predictor. The plot includes a smoother to suggest the functional form. Because the residuals consider all the terms in the model, the other terms in the model affect the pattern in the plot. For terms that are in the model in the correct functional form, the plot usually shows a horizontal line.
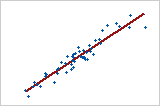
Linear pattern
The following plot shows residuals that follow a straight line. One reason for this pattern is that the model does not include the linear term for the predictor, but the linear term would improve the model.
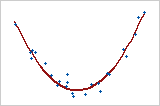
Curved pattern
The following plot shows residuals that follow a curve. One reason for this pattern is that the model does not include the square term for the predictor, but the square term would improve the model.