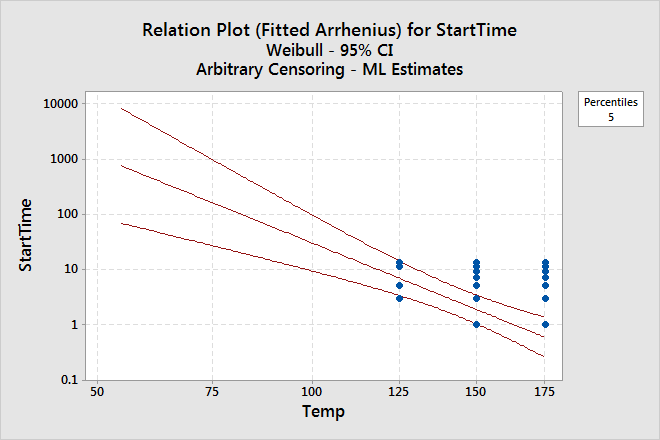
The relation plot shows the percentiles for the fitted model at each level of the accelerating variable and at any normal-use conditions. Interpretation of the relation plot depends on the amount of censoring in your data. When the data have little or no censoring, use the relation plot to check the assumptions about the relationship between failure time (or log failure time) and the accelerating variable. If the points form a linear relationship, with the same slope as the percentile times, then the relationship is appropriate for the accelerating variable levels.
You cannot use this plot to verify the relationship between failure times and normal-use conditions. Only engineering and process knowledge can verify that the relationship holds at normal-use conditions. When the data have heavy censoring, you cannot use the relation plot to check the assumption about the relationship between failure time and the accelerating variable. Censored observations do not appear on the plot; therefore, the relationship may not look linear even when the chosen relationship is appropriate. For the electronic device data, the data are heavily censored, so the validity of this assumption cannot be checked.
Example output
Interpretation
For the electronic device data, the 5th percentile, or the age by which 5% of the electronic devices are expected to fail at specified accelerating variable levels, is of interest.
- At the design temperature of 55.0°C, 5% of the electronic devices are expected to fail by 760 days.
- At the worst-case temperature of 85.0°C, 5% of the electronic devices are expected to fail by 81 days.