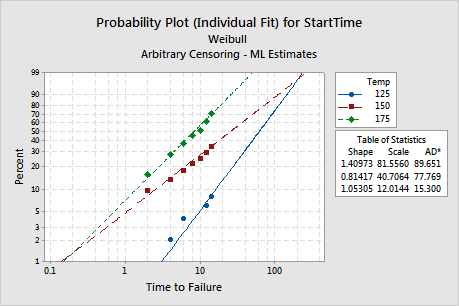
The probability plot for the individual fits does not evaluate the fit of the regression model, but instead evaluates the distribution of the data at each level of the accelerating variable. Use the probability plot at each level of the accelerating variable based on individual fits to check the following:
- Whether the distribution at each level of the accelerating variable is appropriate
- Whether the assumption of equal shape (for the Weibull or exponential distribution) or scale parameter (for other distributions) at each level of the accelerating variable is appropriate
The fitted lines are determined by individually fitting the distribution that you selected to each level of the accelerating variable.
- If the lines are approximately parallel, then you can reasonably assume that the distributions have equal shape (for the Weibull or exponential distribution) or scale (for other distributions) parameters.
- If the plotted points follow each fitted line closely, then the distribution fits the data well.
Example output

Interpretation
For the electronic device data, the fitted line is determined by individually fitting a Weibull distribution to each level of the accelerating variable. The plotted points follow each fitted line reasonably closely, and the fitted lines are approximately parallel; therefore, the distribution and equal shape parameter assumptions are appropriate.
