A residual plot is a graph that is used to examine the goodness-of-fit in regression and ANOVA. Examining residual plots helps you determine whether the ordinary least squares assumptions are being met. If these assumptions are satisfied, then ordinary least squares regression will produce unbiased coefficient estimates with the minimum variance.
Which residual plots are included in Minitab?
Minitab provides the following residual plots:
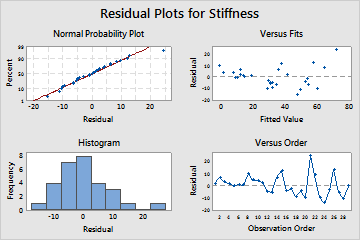
- Histogram of residuals
- Use the histogram of residuals to determine whether the data are skewed or whether outliers exist in the data.
- Normal probability plot of residuals
- Use the normal plot of residuals to verify the assumption that the residuals are normally distributed.
Note
To include the Anderson Darling test with the plot, go to and check Include Anderson-Darling test with normal plot. However, Minitab does not display the test when there are less than 3 degrees of freedom for error.
- Residuals versus fits
- Use the residuals versus fits plot to verify the assumption that the residuals have a constant variance.
- Residuals versus order of data
- Use the residuals versus order plot to verify the assumption that the residuals are uncorrelated with each other.
- Residuals versus predictors
-
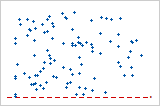
This is a plot of the residuals versus a predictor. This plot should show a random pattern of residuals on both sides of 0. Non-random patterns, such as the following example, may violate the assumption that predictor variables are unrelated to the residuals. You may have used an incorrect functional form to model the curvature.