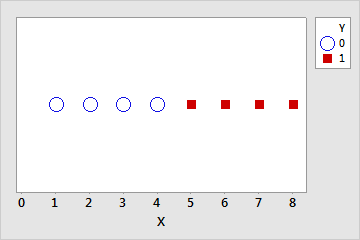
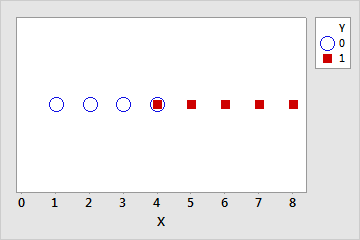
Two conditions exist that prevent the convergence of the maximum likelihood estimates for the coefficients: complete separation and quasi-complete separation.
Complete separation
Complete separation occurs when a linear combination of the predictors yield a perfect prediction of the response variable. For example, in the following data set if X ≤ 4 then Y = 0. If X > 4 then Y = 1.
| Y | 0 | 0 | 0 | 0 | 0 | 0 | 1 | 1 | 1 | 1 |
| X | 1 | 2 | 3 | 4 | 4 | 4 | 5 | 6 | 7 | 8 |

Quasi-complete separation
Quasi-complete separation is similar to complete separation. The predictors yield a perfect prediction of the response variable for most values of the predictors, but not all. For example, in the previous data set, for one of the values where X = 4, let Y = 1 instead of 0. Now, if X < 4 then Y = 0, if X > 4 then Y = 1, but if X = 4 then Y could be 0 or 1. This overlap in the middle range of the data makes the separation quasi-complete.
| Y | 0 | 0 | 0 | 0 | 0 | 1 | 1 | 1 | 1 | 1 |
| X | 1 | 2 | 3 | 4 | 4 | 4 | 5 | 6 | 7 | 8 |

Causes and remediation
Often, separation occurs when the data set is too small to observe events with low probabilities. The more predictors are in the model, the more likely separation is to occur because the individual groups in the data have smaller sample sizes.
Although Minitab prints a warning when it detects separation, the more predictors are in the model the more difficult the identification of the cause of the separation is. The inclusion of interaction terms in the model makes the difficulty even greater.
- Increase the amount of data. Separation often occurs when there is a category or range of a predictor with only one value of the response. A larger sample size increases the probability of different values for the response.
- Consider what the separation means. While complete separation and quasi-complete separation can indicate that the sample size is too small, they can also indicate important relationships. If the true probability of an event at a particular level or combination of levels is close to 0 or 1, this information is important.
- Consider an alternative model. The more terms are in the model, the more likely that separation occurs for at least one variable. When you select terms for the model, you can check whether the exclusion of a term allows the maximum likelihood estimates to converge. If a useful model exists that does not use the term, you can continue the analysis with the new model.
- Check to see whether you can combine categories in problematic variables. If there are categories that are sensible to combine, the separation can disappear from the data set. For example, suppose “Fruit” is a variable in the model. “Grapefruit” has no events because of the small number of trials. Combining “Grapefruit” and “Oranges” into the category “Citrus” eliminates the separation.
Table 1. Data with complete separation Fruit Events Trials Grapefruit 0 10 Oranges 5 100 Apples 25 100 Bananas 40 100 Table 2. Data with overlap Fruit Events Trials Citrus 5 110 Apples 25 100 Bananas 40 100 - Check to see whether a problematic categorical variable is an aggregated variable. If the relationship of the unaggregated variable to the response does not show complete separation, the substitution of the numeric data can eliminate the separation. For example, suppose “Length of employment” is an aggregated variable in the model. When the data are in 30-day increments, the lowest level has all events and the highest level has no events, which creates complete separation. The substitution of the number of days into the model eliminates the separation.
Table 3. Data with complete separation Categories of length Events Trials 1–90 2 2 91–180 1 2 181–270 1 2 271–360 0 2 Exact length Events Trials 45 1 1 60 1 1 95 1 1 176 0 1 185 0 1 241 1 1 280 0 1 299 0 1
Further reading
For more information about separation, please refer to Albert and J. A. Anderson (1984) "On the existence of maximum likelihood estimates in logistic regression models" Biometrika 71, 1, 1–10.
