Note
This command is available with the Predictive Analytics Module. Click here for more information about how to activate the module.
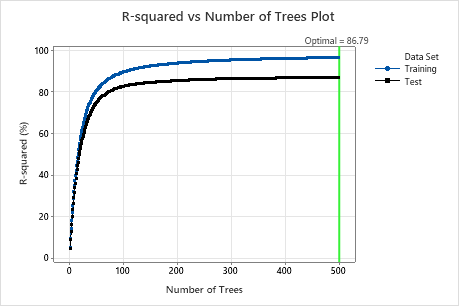
This analysis grows 500 trees. The optimal number of trees is 500. The R2 value for the cross-validation results when the number of trees is 500 is approximately 86.79%.
When the absolute deviation loss function determines the number of trees for the optimal model, then Minitab displays the MAD vs Number of Trees plot.
Interpretation
Higher values of R2 indicate a better model. The reference line indicates the optimal R2 value for the validation results and the number of trees in the model. If the curve from the validation results indicates an insufficient model, consider whether to retry the analysis with alternative settings, such as larger or smaller learning rates, or a larger subsample fraction.
