Note
This command is available with the Predictive Analytics Module. Click here for more information about how to activate the module.
The response optimizer results include the optimization plot, parameters, variable ranges, solutions, and response prediction. Open the graph options to change the appearance of the optimization plot. For more information about the response optimizer, go to Overview for Response Optimizer. Use the results to determine the optimal settings for the predictors given the specifications in the analysis.
Optimization plot
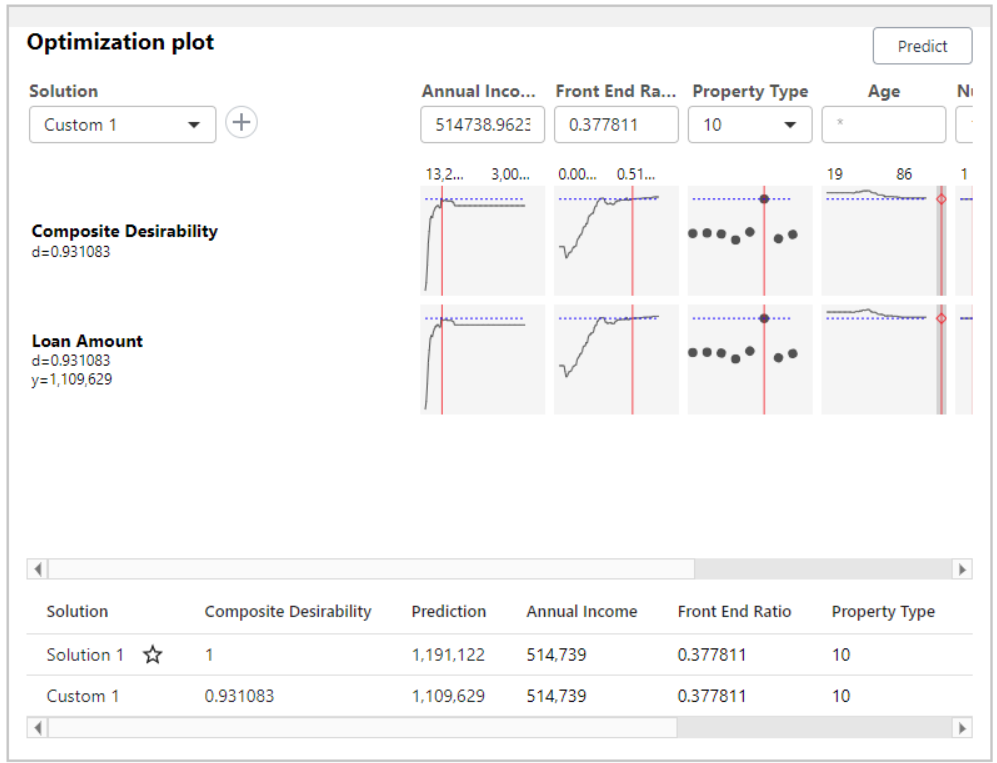
The optimization plot shows how the variables affect the predicted responses. The cells show how the corresponding response variable or composite desirability changes as a function of one of the variables, while all other variables remain fixed.
To examine the desirability for new predictor settings, drag the red lines or enter a value above the column for the predictor. Select + to add a solution to the table on the plot. To create a Prediction table for a solution, select the solution, then select Predict from the menu for the plot.
For variables with missing values in the training data, a missing value symbol is on the right side of the plot for the variable. To specify a missing value in a custom solution, drag the setting to the right. Another method is to select the missing value from the levels of a categorical variable or to delete all values for a continuous variable.
Parameters
Minitab displays the design parameters for each response in the Parameters table. Examine these results to verify that the displayed design parameters are correct.
Your choices of goal, lower, target, upper, and weight define the desirability function for each individual response. The importance parameters determine how the desirability functions are combined into a single composite desirability.
Variable ranges
Minitab displays the ranges for the predictors. The table also displays whether the analysis includes missing values for a variable. Examine these results to verify that the analysis used the correct region.
If you specify hold values or constraints, then the analysis limits the ranges for the predictors. Otherwise, the range for a continuous variable is from the minimum value in the training data to the maximum value in the training data. The range for a categorical variable is all the levels in the training data.
Solution
Minitab displays the predictor values, fitted value, and composite desirability for each solution from the analysis. The number of solutions depends on the specifications in Results for the creation of the plot.
Response prediction
Minitab uses the variable settings in this table to calculate the fits for all of the responses that are included in the optimization procedure. Use this table to verify that you performed the analysis as you intended.
When you first run Response Optimizer, the table displays the optimal value that the algorithm identifies. If the analysis specifies multiple solutions, then the optimal value is for Solution 1. If you change the variable settings on the graph and select Predict, then Minitab makes a table with the new settings.
Graph Options
- Options
- Select the options to make them active.
- Show composite desirability plots: Display a row of plots with the composite desirability on the y-axis.
- Notify me when a new optimal solution is discovered: Display a message if the interactive settings identify a better solution than any solution in the table.
- Automatically add new optimal solutions to the solutions table: If the interactive settings identify a new best solution, add the solution to the table without selecting +.
- Classification Models
- For models with categorical response variables, select how many rows to
show on the plot.
- Show a row of plots for each response variable class: Display all possible rows.
- Show a row of plots for each optimizer class: Display a subset of rows only for the classes that are part of the goal.
- Show a row of plots for the total probability of all optimizer classes: Display only 1 row that summarizes all the classes that are part of the goal.
- Size
- Specify the size of the optimization plot. The selectable graph sizes that end in "wide" have an aspect ratio that is approximately 16:9. Use the Width and Height to specify custom sizes. Toggle the button between Width and Height to maintain or vary the aspect ratio as you change the individual dimensions.
- Predictor Variables
- Select the predictors to display on the plot.