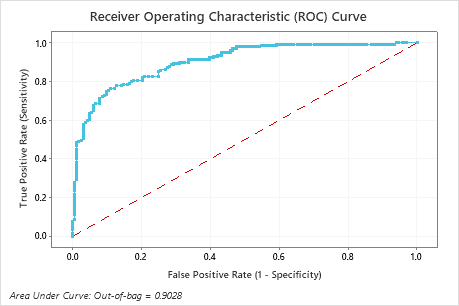
The ROC curve plots the true positive rate (TPR), also known as power, on
the y-axis. The ROC curve plots the false positive rate (FPR), also known as
type 1 error, on the x-axis. The area under an ROC curve indicates whether the
model is a good classifier.
Interpretation
For classification trees, the area under the ROC curve values typically
range from 0.5 to 1. Larger values indicate a better classification model. When
the model can perfectly separate the classes, then the area under the curve is
1. When the model cannot separate the classes better than a random assignment,
then the area under the curve is 0.5. The red dotted line indicates the random
assignment case.
The area under the curve with out-of-bag data is approximately
0.90. You can use the area under the curve to compare the accuracy of the
Random
Forests® Classification
to another model, such as a
TreeNet®
Classification.