Note
This command is available with the Predictive Analytics Module. Click here for more information about how to activate the module.
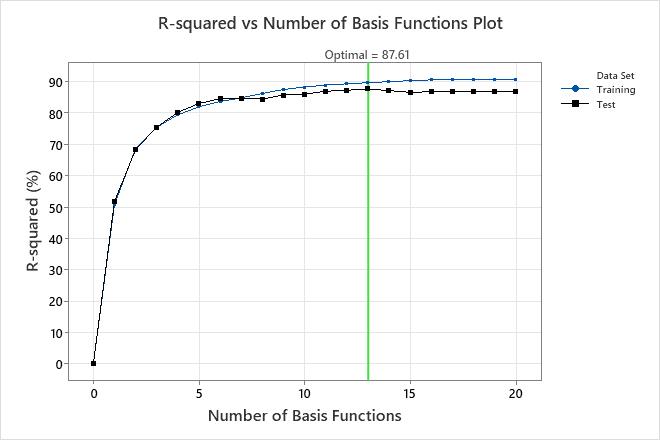
The largest x-value for a point shows that this analysis evaluates 20 basis functions. The optimal number of basis functions is 13. The R2 value for the test data when the number of basis functions is 13 is approximately 87.61%.
When the absolute deviation loss function determines the optimal model, then the results include the MAD vs number of basis functions plot instead.
Interpretation
Higher values of R2 indicate a better model. The reference line indicates the optimal R2 value for the validation results and the number of basis functions in the model. If the validation curve indicates an insufficient model, consider whether to retry the analysis with alternative settings, such as a search of more basis functions.