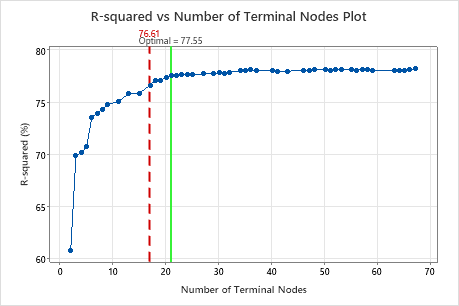
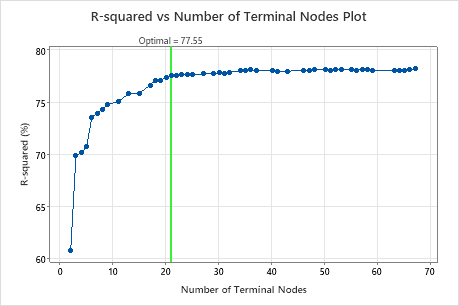
The R-squared vs Number of Terminal Nodes Plot displays the R2 value for each tree. By default, the initial regression tree is the smallest tree with an R2 value within 1 standard error of the value for the maximum R2 value. When the analysis uses cross-validation or a test data set, the R2 value is from the validation sample. The values for the validation sample typically level off and eventually start to decline as the tree grows larger.
Click Select Alternative Tree to open an interactive plot that includes a table of model summary statistics. Use the plot to investigate alternative trees with similar performance.
- The tree that Minitab selects is part of a pattern where the criterion improves. One or more trees that have a few more nodes are part of the same pattern. Typically, you want to make predictions from a tree with as much prediction accuracy as possible.
- The tree that Minitab selects is part of a pattern where the criterion is relatively flat. One or more trees with similar model summary statistics have much fewer nodes than the optimal tree. Typically, a tree with fewer terminal nodes gives a clearer picture of how each predictor variable affects the response values. A smaller tree also makes it easier to identify a few target groups for further studies. If the difference in prediction accuracy for a smaller tree is negligible, you can also use the smaller tree to evaluate the relationships between the response and the predictor variables
Interpretation
Key Result: R-squared vs Number of Terminal Nodes Plot for Tree with 21 Terminal Nodes
The regression tree with 21 terminal nodes has an R2 value of approximately 0.78. This tree has the label "Optimal" because the criterion for the creation of the tree was the smallest tree with an R2 value within 1 standard deviation of the maximum R2 value. Because this chart shows that the R2 values are relatively stable between trees with about 20 nodes to trees with about 70 nodes, the researchers want to look at the performance of some of the even smaller trees that are similar to the tree in the results. Compare the next graph to see results for a tree with 17 nodes.
Key Result: R-squared vs Number of Terminal Nodes Plot for Tree with 17 Terminal Nodes
The regression tree with 17 terminal nodes has an R2 value of 0.7661. The tree from the initial results keeps the label "Optimal" when you use Select Alternative Tree to create results for a different tree.