Overview
- The optimal tree is part of a pattern where the misclassification costs decrease. One or more trees that have a few more nodes are part of the same pattern. Typically, you want to make predictions from a tree with as much prediction accuracy as possible. If the tree is simple enough, you can also use it to understand how each predictor variable affects the response values.
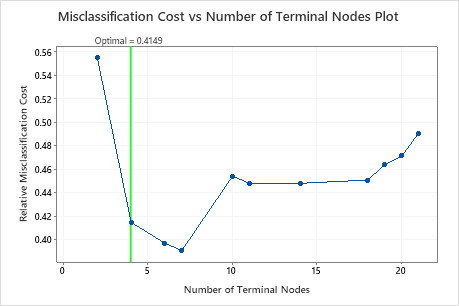
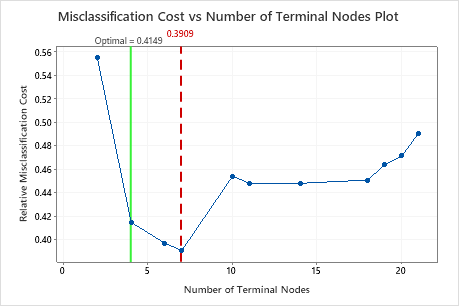
- The optimal tree is part of a pattern where the misclassification costs are relatively flat. One or more trees with similar model summary statistics have much fewer nodes than the optimal tree. Typically, a tree with fewer terminal nodes gives a clearer picture of how each predictor variable affects the response values. A smaller tree also makes it easier to identify a few target groups for further studies. If the difference in prediction accuracy for a smaller tree is negligible, you can also use the smaller tree to evaluate the relationships between the response and the predictor variables
- The analyst chooses a smaller tree that provides a clearer view of the most important variables.
- The analysis chooses a tree because the splits are on variables that are easier to measure than the variables in another tree.
- The analyst chooses a tree because a particular terminal node is of interest.
Perform the analysis
Click Select Alternative Tree in the output. A dialog box opens that shows the plot, a tree diagram, and a table that summarizes the tree or the selected node.
Select an alternate tree
- Click a point on the graph.
- Click the arrow buttons under the model summary table to select a tree that is one tree larger or smaller than the current selection.
- Click a button to select a
tree that is a common choice. When the analysis does not use validation, the
buttons that refer to the standard error do not apply.
- Min Cost
- Select the tree with the minimum misclassification cost
- 1-SE Min Cost
- Select the smallest tree that has a misclassification cost within one standard error of the minimum cost.
- 2-SE Min Cost
- Select the smallest tree that has a misclassification cost within 2 standard errors of the minimum cost.
- Best ROC
- Select the tree with the greatest area under the ROC curve.
Investigate the tree and individual nodes
- Highlight the 5 nodes with the most purity. These nodes are the optimal nodes.
- Switch between the Detailed Tree and the Node Split Tree. The Node Split Tree is helpful when you have a large tree and want to see only which variables split the nodes.
- Zoom in and out on the tree.
You can select individual nodes on the tree to see details about the node in the table. The details include counts of individual classes and the total count. The details also include the rules to arrive at the node. Click Copy rules to clipboard so that you can paste the rules in another place.
To reselect the entire tree, click anywhere in the diagram that is not an individual node.
Create a new tree
Click Create Tree to create and store results for an alternative tree that you choose. The selections for results and storage are the same as for the original tree. The graphs and tables for the alternative tree are in a new output tab. The stored columns are in the worksheet with the original data.