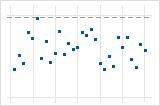
- Scree plot
- Use a scree plot to identify the number of components that explain most of the variation in the data.

- Score plot for first 2 components
- Use the score plot to look for clusters, trends, and outliers in the first two principal components.
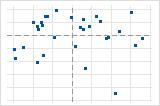
Note
To create score plots for other components, store the scores and choose to display them.
- Loading plot for first 2 components
- Use the loading plot to visually interpret the first two principal components.
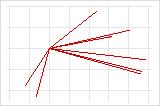
Note
To create simple loading plots for other components, store the loadings and use to display them. If you want to connect the loading point to the zero point, add a zero to the bottom of each column of loadings in the worksheet, then add lines connecting the loading points to the zero point using the graph annotation tools.
- Biplot for first 2 components
- Use the biplot to look for clusters, trends, and outliers through the interpretation of the first two principal components. The biplot overlays the score plot and the loading plot on the same graph.

- Outlier plot
- Use the outlier plot to identify outliers in the data.