In This Topic
Principal components method
In principal components analysis, Minitab first finds the set of orthogonal eigenvectors of the correlation or covariance matrix of the variables. The matrix of principal components is the product of the eigenvector matrix with the matrix of independent variables. The first principal component accounts for the largest percent of the total data variation. The second principal component accounts the second largest percent of the total data variation, and so on. The goal of principal components is to explain the maximum amount of variance with the fewest number of components.
Nonuniqueness of coefficients
The coefficients for the principal components are unique (except for a change in sign) if the eigenvalues are distinct and not zero. If an eigenvalue is repeated, then the "space spanned" by all the principal component vectors corresponding to the same eigenvalue is unique, but the individual vectors are not. Therefore, the coefficients that Minitab displays in output and those in a book or another program may not agree, although the eigenvalues (variances of the components) will always be the same.
If the covariance matrix has rank r < p, where p is the number of variables, then there will be p – r eigenvalues equal to zero. Eigenvectors corresponding to these eigenvalues may not be unique. This can happen if the number of observations is less than p or if there is multicollinearity.
Eigenvectors
Eigenvectors, which are comprised of coefficients corresponding to each variable, are the weights for each variable used to calculate the principal components scores. The eigenvectors are obtained as the columns of the orthogonal matrix in the spectral decomposition of the covariance or correlation matrix, S or R. More specifically, because R is symmetric, an orthogonal matrix V exists such that V'RV = D or, equivalently, R = VDV', where D is a diagonal matrix whose diagonal elements are the eigenvalues. The eigenvectors are the columns of V.The eigenvectors originate from R = V D V'.
Notation
| Term | Description |
|---|---|
| R | correlation matrix |
| V | eigenvector matrix |
| D | diagonal matrix of eigenvalues |
Scores
Formula
Scores are the linear combinations of the original variables that account for the variance in the data.
The scores are calculated as follows: Z = YV
Notation
| Term | Description |
|---|---|
| Z | matrix of principal components scores (n × m) |
| Y | standardized data matrix (n × p) used with the correlation matrix method |
| V | matrix of eigenvectors (p × m) |
Note
If you use the covariance matrix method instead of the correlation matrix method (the default), then Minitab uses the raw data matrix for Y instead of the standardized data matrix.
Eigenvalue
Formula
The eigenvalues are the diagonal elements of the diagonal matrix in the spectral decomposition of the covariance or correlation matrix (see the topic "Eigenvectors"). The eigenvalues also represent the sample variances of the principal components Z = V Y.
Notation
| Term | Description |
|---|---|
| Z | matrix of principal components scores (n × m) |
| Y | standardized data matrix (n × p) used with the correlation matrix method |
| V | matrix of eigenvectors (p × m) |
Note
If you use the covariance matrix method instead of the correlation matrix method (the default), then Minitab uses the raw data matrix for Y instead of the standardized data matrix.
Proportion
Formula
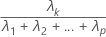
The proportion of sample variance explained by the kth principal component is calculated as follows:
Notation
| Term | Description |
|---|---|
 | the kth eigenvalue |
| p | the number of variables |
Cumulative proportion
Formula
The cumulative proportion of sample variance explained by the first k principal components is calculated as follows: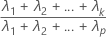
Notation
| Term | Description |
|---|---|
 | the kth eigenvalue |
| p | the number of variables |
Mahalanobis distance
Formula
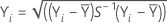

When n – p – 1 is  0, Minitab displays the outlier plot without the reference line.
Notation
| Term | Description |
|---|---|
| Yi | data value vector at row i |
 | mean vector |
| S-1 | inverse of the covariance matrix |
| p | the number of variables |
| n | the number of nonmissing rows |