A researcher wants to explore how different categories of automobile accidents relate to each other. The automobile accidents are classified according to type, severity, car size, and driver ejection.
The researcher performs multiple correspondence analysis to examine how the categories in the four-way table relate to each other.
- Open the sample data set, AutomobileAccident.MWX.
- Choose .
- Select Categorical variables and enter CarWt DrEject AccType AccSever.
- In Category names, enter AccNames.
- In Number of components, enter 2.
- Click Graphs and select Display column plot.
- Click OK in each dialog box.
Interpret the results
The Analysis of Indicator Matrix summarizes the decomposition of the variables and shows the inertia accounted for by each component. Of the total inertia of 1, approximately 40.3% is accounted for by component (axis) 1, 25.2% is accounted for by component (axis) 2, 19% is accounted for by component (axis) 3, and 15.5% is accounted for by component (axis) 4. Cumulatively, approximately 84.5% of the total inertia is accounted for by the first 3 components.
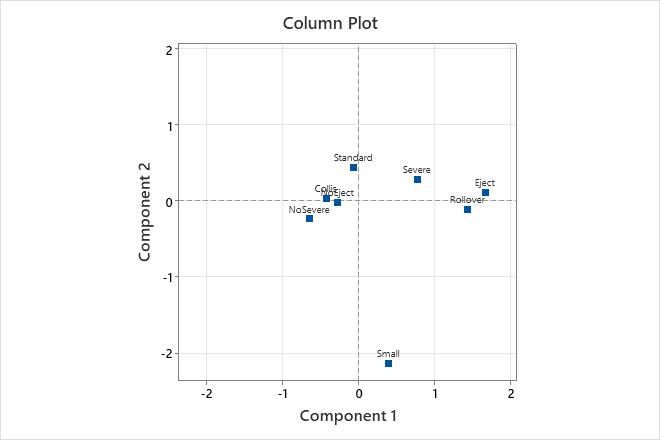
Using the Column Contributions table and the column plot, the researcher can interpret the components in relation to the categories. In the table, the quality value (Qual) indicates the proportion of the column inertia represented by the calculated components. In this example, the car-size categories Small and Standard are best represented by the two components (Qual = 0.965). The ejection categories are the least represented by the two components (Qual = 0.474). The column labeled Mass is the proportion of the class in the whole data set. Eject (0.037) and Rollover (0.057) are relatively rare.
The Coord column provides the column coordinates, which are displayed in the column plot. Correlation (Corr) represents the contribution of the respective component to the inertia of each category. For example, component 1 accounts for 61% of the inertia of the accident type categories (Collis and Rollover). Component 2 accounts for 93.6% of the inertia of the car size categories Small and Standard.
Contr, the contribution of the row to the axis inertia, shows that Eject (Contr = 0.250) and Rollover (Contr = 0.291 contribute the most to component 1. The car sizes Small (0.771) and Standard (0.158) contribute most to component 2.
In the column plot, Eject and Rollover are most distant from the origin along the horizontal axis for component 1. This corresponds with the relatively high contribution (Contr) for these categories for component 1. Because Eject and No Eject, as well as Severe and NoSevere, are on opposite sides of the origin, component 1 contrasts these category values. Component 2 is shown on the vertical axis. The Small car size located far from the other categories on one side of the vertical axis. Therefore, component 2 contrasts the Small car size with other categories.
However, these results should be interpreted with caution, because two components may not adequately explain the variability of these data.
Analysis of Indicator Matrix
| Axis | Inertia | Proportion | Cumulative | Histogram |
|---|---|---|---|---|
| 1 | 0.4032 | 0.4032 | 0.4032 | ****************************** |
| 2 | 0.2520 | 0.2520 | 0.6552 | ****************** |
| 3 | 0.1899 | 0.1899 | 0.8451 | ************** |
| 4 | 0.1549 | 0.1549 | 1.0000 | *********** |
| Total | 1.0000 |
Column Contributions
| Component 1 | Component 2 | |||||||||
|---|---|---|---|---|---|---|---|---|---|---|
| ID | Name | Qual | Mass | Inert | Coord | Corr | Contr | Coord | Corr | Contr |
| 1 | Small | 0.9655 | 0.0424 | 0.2076 | 0.3814 | 0.0297 | 0.0153 | -2.1394 | 0.9357 | 0.7707 |
| 2 | Standard | 0.9655 | 0.2076 | 0.0424 | -0.0780 | 0.0297 | 0.0031 | 0.4374 | 0.9357 | 0.1576 |
| 3 | NoEject | 0.4739 | 0.2134 | 0.0366 | -0.2844 | 0.4717 | 0.0428 | -0.0197 | 0.0023 | 0.0003 |
| 4 | Eject | 0.4739 | 0.0366 | 0.2134 | 1.6587 | 0.4717 | 0.2497 | 0.1151 | 0.0023 | 0.0019 |
| 5 | Collis | 0.6133 | 0.1926 | 0.0574 | -0.4264 | 0.6095 | 0.0868 | 0.0338 | 0.0038 | 0.0009 |
| 6 | Rollover | 0.6133 | 0.0574 | 0.1926 | 1.4294 | 0.6095 | 0.2911 | -0.1133 | 0.0038 | 0.0029 |
| 7 | NoSevere | 0.5680 | 0.1353 | 0.1147 | -0.6523 | 0.5018 | 0.1428 | -0.2371 | 0.0663 | 0.0302 |
| 8 | Severe | 0.5680 | 0.1147 | 0.1353 | 0.7692 | 0.5018 | 0.1684 | 0.2795 | 0.0663 | 0.0356 |