In This Topic
Step 1: Assess the strength and direction of the relationship between pairs of items
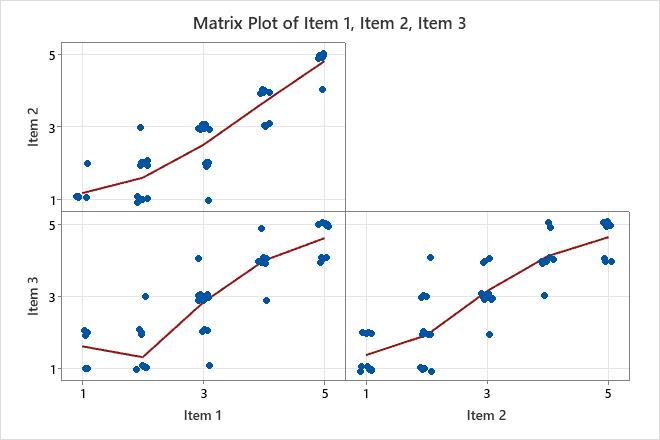
Use the matrix plot and the correlation matrix to assess the strength and direction of the relationship between two items or variables. A high, positive correlation value indicates that items measure the same skill or characteristic. If the items are not highly correlated, then the items may measure different characteristics or not be clearly defined.
Often, variables with correlation values greater than 0.7 are considered highly correlated. However, the appropriate benchmark value to use also depends on the standards in your subject area and the number of items in the analysis.
Key Results: Correlation matrix, Matrix plot
In these results, all the items are highly correlated to each other. Item 1 and Item 2 have a positive linear correlation of 0.903. Item 1 and Item 3 have a positive linear correlation of 0.867. Item 2 and Item 3 have a positive linear correlation of 0.864. These pairwise linear relationships are shown on the matrix plot.
Step 2: Evaluate the overall internal consistency
Use Cronbach's alpha to assess how consistently multiple items in a survey or test assess the same skill or characteristic. Higher values of Cronbach's alpha suggest higher internal consistency. A benchmark value of 0.7 is commonly used. Generally, if Cronbach's alpha is greater than 0.7, then you have evidence that the survey or test items measure the same skill or characteristic. If Cronbach's alpha is below 0.7, then the items may not consistently measure a single skill or characteristic. However, the appropriate benchmark value to use also depends on the standards in your subject area and the number of items in the analysis.
For more information on internal consistency, go to What is internal consistency?.
Cronbach’s Alpha
| Alpha |
|---|
| 0.9550 |
Key Results: Cronbach's alpha
In these results, the overall Cronbach's alpha is 0.9550. The value is greater than the common benchmark of 0.7 and suggests that the items are measuring the same characteristic.
Step 3: Determine whether to omit items to improve consistency
Use the calculated values in the Omitted Item Statistics table to determine whether removing an item substantially improves the internal consistency of the test or survey. If an omitted item has a low squared multiple correlation value, a low item-adjusted total correlation value, and a substantially higher Cronbach's alpha value, then you might consider removing the item from the survey or test to improve its internal consistency.
Omitted Item Statistics
| Omitted Variable | Adj. Total Mean | Adj. Total StDev | Item-Adj. Total Corr | Squared Multiple Corr | Cronbach’s Alpha |
|---|---|---|---|---|---|
| Item 1 | 5.780 | 2.613 | 0.9166 | 0.8447 | 0.9268 |
| Item 2 | 6.100 | 2.525 | 0.9134 | 0.8413 | 0.9277 |
| Item 3 | 6.000 | 2.563 | 0.8870 | 0.7869 | 0.9476 |
Key Results: Item-Adj Total Corr, Squared Multiple Corr, Cronbach's Alpha
In these results, the item-adjusted total correlation and squared multiple correlation values are consistently high for all the items. The Cronbach's alpha for all the omitted items is also consistent. Therefore, the evidence suggests that all items measure the same characteristic. Removing an item would not substantially improve the internal consistency.