A customer relations manager for a chain of restaurants wants to use a survey to assess customer satisfaction. The restaurant manager tests the survey questions in a pilot study to ensure that the questions consistently measure customer satisfaction. The manager randomly chooses 50 customers, asks them three questions, and records their responses on a 5-point Likert scale, where 1 is Not satisfied/Unlikely and 5 is Very satisfied/Highly likely.
- Open the sample data, CustomerSatisfaction.MWX.
- Choose .
- In Variables, enter 'Item 1' 'Item 2' 'Item 3'.
- Click Graphs and ensure that Matrix plot of data with smoother is selected.
- Click OK in each dialog box.
Interpret the results
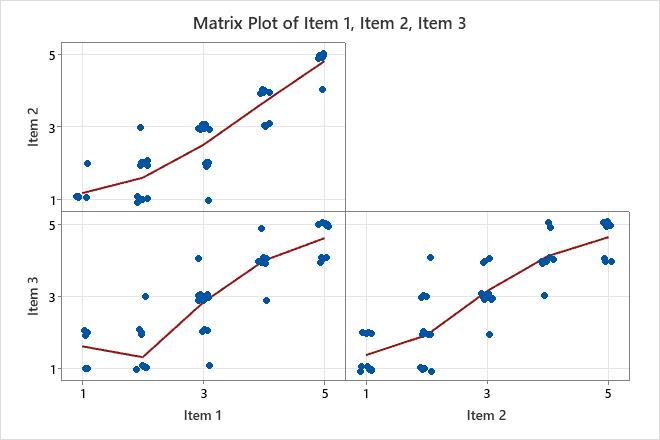
The high, positive values in the Correlation Matrix table indicate that all the items are highly correlated with each other. The matrix plot also shows that all the items have a linear and positive relationship. The overall Cronbach's alpha is 0.9550, which is greater than the common benchmark of 0.7. Therefore, the manager concludes that all the survey questions are measuring the same characteristic (customer satisfaction).
Item and Total Statistics
| Variable | Total Count | Mean | StDev |
|---|---|---|---|
| Item 1 | 50 | 3.1600 | 1.2675 |
| Item 2 | 50 | 2.8400 | 1.3607 |
| Item 3 | 50 | 2.9400 | 1.3463 |
| Total | 50 | 8.9400 | 3.8087 |
Cronbach’s Alpha
| Alpha |
|---|
| 0.9550 |
Omitted Item Statistics
| Omitted Variable | Adj. Total Mean | Adj. Total StDev | Item-Adj. Total Corr | Squared Multiple Corr | Cronbach’s Alpha |
|---|---|---|---|---|---|
| Item 1 | 5.780 | 2.613 | 0.9166 | 0.8447 | 0.9268 |
| Item 2 | 6.100 | 2.525 | 0.9134 | 0.8413 | 0.9277 |
| Item 3 | 6.000 | 2.563 | 0.8870 | 0.7869 | 0.9476 |