In This Topic
Step
The number of the step in the amalgamation procedure for joining the clusters. At each step, a new cluster is joined to an existing cluster and their similarity level and distance level are calculated.
Number of clusters
The number of clusters that are formed in each step of the amalgamation process. Before the first step, the number of clusters equals the total number of observations (for cluster observations) or the total number of variables (for cluster variables). In the first step, two clusters are joined to form a new cluster. At each subsequent step, another cluster is joined to an existing cluster to form a new cluster. At the final step, all the observations or variables are combined into a single cluster.
You can enter the number of clusters on the main dialog box to specify the final partition of your data. Your choice of linkage method and distance measure greatly influences the clustering outcome.
Similarity level
The percentage of the minimum distance between clusters at each amalgamation step relative to the maximum inter-observation distance in the data. Similarity, s(ij), between two clusters i and j is given by s(ij) = 100 * [1 - d(ij)) / d(max)], where d(max) is the maximum value in the original distance matrix, D, with entry d(ij) for the distance between i and j.
Interpretation
Use the similarity level for the clusters that are joined at each step to help determine the final groupings for the data. Look for an abrupt change in the similarity level between steps. The step that precedes the abrupt change in similarity may provide a good cut-off point for the final partition. For the final partition, the clusters should have a reasonably high similarity level. You should also use your practical knowledge of the data to determine the final groupings that make the most sense for your application.
For example, the following amalgamation table shows that the similarity level decreases slightly from step 1 (93.9666) to step 2 (93.1548). The similarity then decreases abruptly in step 3 (87.3150), when the number of clusters changes from 3 to 2. These results indicate that 3 clusters may be appropriate for the final partition. If this grouping makes intuitive sense, then it is probably a good choice.
Amalgamation Steps
| Step | Number of clusters | Similarity level | Distance level | Clusters joined | New cluster | Number of obs. in new cluster | |
|---|---|---|---|---|---|---|---|
| 1 | 4 | 93.9666 | 0.120669 | 2 | 3 | 2 | 2 |
| 2 | 3 | 93.1548 | 0.136904 | 4 | 5 | 4 | 2 |
| 3 | 2 | 87.3150 | 0.253700 | 1 | 4 | 1 | 3 |
| 4 | 1 | 79.8113 | 0.403775 | 1 | 2 | 1 | 5 |
Distance level
The distance between clusters (using the chosen linkage method) or variables (using the chosen distance measure) that are joined at each step. Minitab calculates the distance level based on the linkage method and the distance measure that you select in the main dialog box.
The distance between two variables is directly related to their correlation. That is, for two variables, X1 and X2, Distance equals 1− Correlation. For example, if Corr(X1,X2) = 0.879, then Distance(X1,X2) = 1 − 0.879 = 0.121.
Interpretation
Use the distance level for the clusters that are joined at each step to help determine the final groupings for the data. Look for an abrupt change in the distance level between steps. The step that precedes the abrupt change in distance may provide a good cut-off point for the final partition. For the final partition, the clusters should have a reasonably small distance level. You should also use your practical knowledge of the data to determine the final groupings that make the most sense for your application.
For example, the following amalgamation table shows that the distance level increases slightly from step 1 (0.120669) to step 2 (0.136904). The distance then increases more abruptly in step 3 (0.253700), when the number of clusters changes from 3 to 2. These results indicate that 3 clusters may be appropriate for the final partition. If this grouping makes intuitive sense, then it is probably a good choice.
Amalgamation Steps
| Step | Number of clusters | Similarity level | Distance level | Clusters joined | New cluster | Number of obs. in new cluster | |
|---|---|---|---|---|---|---|---|
| 1 | 4 | 93.9666 | 0.120669 | 2 | 3 | 2 | 2 |
| 2 | 3 | 93.1548 | 0.136904 | 4 | 5 | 4 | 2 |
| 3 | 2 | 87.3150 | 0.253700 | 1 | 4 | 1 | 3 |
| 4 | 1 | 79.8113 | 0.403775 | 1 | 2 | 1 | 5 |
Clusters joined
The two clusters that are joined to form a new cluster at each step in the amalgamation process.
New cluster
The identification number of the new cluster that is formed at each step in the amalgamation process. The identification number for the new cluster is always the smaller of the identification numbers of the two clusters that are joined. For example, if cluster 2 and cluster 9 are joined, then the new cluster that is formed is called cluster 2.
Number of observations in new cluster
The number of observations in each new cluster at each step in the amalgamation process. In the final step, all the observations are combined into a single cluster. Therefore, the number of observations in the new cluster for the last step equals the total number of observations in the data.
Note
For Cluster Variables, the number of observations is the number of variables in the new cluster.
Final Partition
If you specify a final partition on the main dialog box, Minitab displays a list of the variables in each cluster. The variables within each cluster in the final partition should make intuitive sense, based on your specific application.
Dendrogram
The dendrogram is a tree diagram that displays the groups formed by clustering of variables at each step and their similarity levels. The similarity level is measured along the vertical axis (alternately, you can display the distance level), and the different variables are listed along the horizontal axis.
Interpretation
Use the dendrogram to view how the clusters were formed at each step and to assess the similarity (or distance) levels of the clusters formed.
To view the similarity (or distance) levels, hold your pointer over a horizontal line in the dendrogram. The pattern of how similarity or distance values change from step to step can help you to choose the final grouping for your data. The step where the values change abruptly may identify a good point to define the final grouping.
The decision about final grouping is also called cutting the dendrogram. Cutting the dendrogram is akin to drawing a line across the dendrogram to specify the final grouping. You can also compare dendrograms for different final groupings to help you to decide which one makes the most sense for your data.
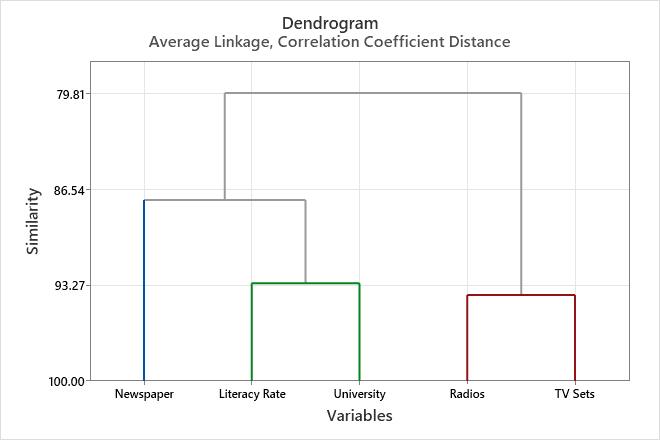
This dendrogram was created using a final partition of 3 clusters. Each final cluster is indicated by a separate color. The dendrogram was "cut" at a similarity level of approximately 88. If the dendrogram had been cut higher, there would be fewer final clusters, but the similarity level would be reduced. If the dendrogram had been cut lower, the similarity level would be greater, but there would be more final clusters.
Note
For some data sets, average, centroid, median and Ward's methods may not produce a hierarchical dendrogram. That is, the amalgamation distances do not always increase with each step. In the dendrogram, such a step will produce a join that goes downward rather than upward.