A social scientist wants to study effects of the number of media outlets and universities and the literacy rate on the college admissions of the population. For 10 cities around the world, the scientist determines the number of newspaper copies, radios, and television sets per 1,000 people. The scientist also records the literacy rate and whether a university is in each city. The scientist wants to reduce the total number of variables by combining variables with similar characteristics.
- Open the sample data set, CollegeAdmissions.MWX.
- Choose .
- In Variables or distance matrix, enter Newspaper Radios 'TV Sets' 'Literacy Rate' University.
- From Linkage method, select Average.
- Under Distance measure, select Correlation.
- Select Show dendrogram.
- Click OK.
Interpret the results
- The similarity level decreases slightly from step 1 (93.9666) to step 2 (93.1548), then decreases abruptly in step 3 (87.3150), when the number of clusters changes from 3 to 2.
- The distance between the joined clusters increases slightly by approximately 0.017 from step 1 to step 2, then increases more abruptly in step 3, when the number of clusters changes from 3 to 2.
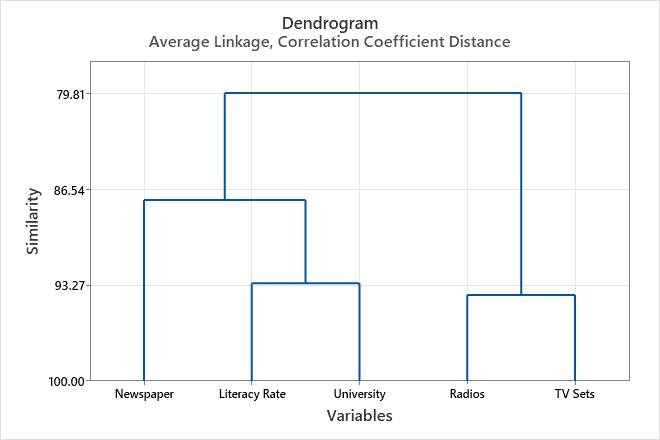
The distance and similarity results indicate that 3 clusters are reasonably sufficient for the final partition. If the social scientists thinks this grouping makes intuitive sense, then it is probably a good choice. The dendrogram displays the information in the table in the form of a tree diagram.
The social scientist should rerun the analysis and specify 3 clusters in the final partition. When you specify a final partition, Minitab displays additional tables that describe the characteristics of each cluster included in the final partition.
Amalgamation Steps
| Step | Number of clusters | Similarity level | Distance level | Clusters joined | New cluster | Number of obs. in new cluster | |
|---|---|---|---|---|---|---|---|
| 1 | 4 | 93.9666 | 0.120669 | 2 | 3 | 2 | 2 |
| 2 | 3 | 93.1548 | 0.136904 | 4 | 5 | 4 | 2 |
| 3 | 2 | 87.3150 | 0.253700 | 1 | 4 | 1 | 3 |
| 4 | 1 | 79.8113 | 0.403775 | 1 | 2 | 1 | 5 |

