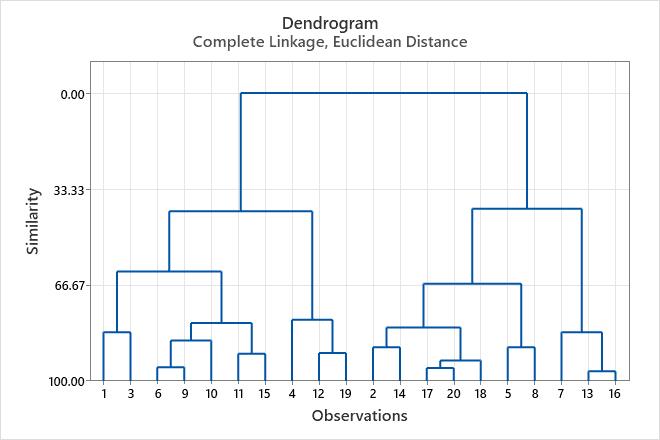
A designer for a sporting goods company wants to test a new soccer goalie glove. The designer has 20 athletes wear the new glove and collects the gender, height, weight, and handedness information of the athletes. The designer wants to group the athletes by their similarities.
- Open the sample data set, GloveTesters.MWX.
- Choose .
- In Variables or distance matrix, enter Gender Height Weight Handedness.
- From Linkage method, select Complete. From Distance measure, select Euclidean.
- Select Standardize variables.
- Select Show dendrogram.
- Click OK.
Interpret the results
- The similarity level decreases by increments of approximately 3 or less until step 15. The similarity decreases by more than 20 (from 62.0036 to 41.0474) at steps 16 and 17, when the number of clusters changes from 4 to 3.
- The distance between the joined clusters increases, first by approximately 0.6 or less. The distance increases by more than 1 (from 1.81904 to 2.82229) at steps 16 and 17, when the number of clusters changes from 4 to 3.
The distance and similarity results indicate that 4 clusters are reasonably sufficient for the final partition. If this grouping makes intuitive sense to the designer, then it is probably a good choice. The dendrogram displays the information in the table in the form of a tree diagram.
The designer should rerun the analysis and specify 4 clusters in the final partition. When you specify a final partition, Minitab displays additional tables that describe the characteristics of each cluster that is included in the final partition.
Amalgamation Steps
| Step | Number of clusters | Similarity level | Distance level | Clusters joined | New cluster | Number of obs. in new cluster | |
|---|---|---|---|---|---|---|---|
| 1 | 19 | 96.6005 | 0.16275 | 13 | 16 | 13 | 2 |
| 2 | 18 | 95.4642 | 0.21715 | 17 | 20 | 17 | 2 |
| 3 | 17 | 95.2648 | 0.22669 | 6 | 9 | 6 | 2 |
| 4 | 16 | 92.9178 | 0.33905 | 17 | 18 | 17 | 3 |
| 5 | 15 | 90.5296 | 0.45339 | 11 | 15 | 11 | 2 |
| 6 | 14 | 90.3124 | 0.46378 | 12 | 19 | 12 | 2 |
| 7 | 13 | 88.2431 | 0.56285 | 2 | 14 | 2 | 2 |
| 8 | 12 | 88.2431 | 0.56285 | 5 | 8 | 5 | 2 |
| 9 | 11 | 85.9744 | 0.67146 | 6 | 10 | 6 | 3 |
| 10 | 10 | 83.0639 | 0.81080 | 7 | 13 | 7 | 3 |
| 11 | 9 | 83.0639 | 0.81080 | 1 | 3 | 1 | 2 |
| 12 | 8 | 81.4039 | 0.89027 | 2 | 17 | 2 | 5 |
| 13 | 7 | 79.8185 | 0.96617 | 6 | 11 | 6 | 5 |
| 14 | 6 | 78.7534 | 1.01716 | 4 | 12 | 4 | 3 |
| 15 | 5 | 66.2112 | 1.61760 | 2 | 5 | 2 | 7 |
| 16 | 4 | 62.0036 | 1.81904 | 1 | 6 | 1 | 7 |
| 17 | 3 | 41.0474 | 2.82229 | 1 | 4 | 1 | 10 |
| 18 | 2 | 40.1718 | 2.86421 | 2 | 7 | 2 | 10 |
| 19 | 1 | 0.0000 | 4.78739 | 1 | 2 | 1 | 20 |
Final Partition
| Number of observations | Within cluster sum of squares | Average distance from centroid | Maximum distance from centroid | |
|---|---|---|---|---|
| Cluster1 | 20 | 76 | 1.91323 | 2.53613 |

