Method for response tables
Minitab calculates a response table for each response characteristic (i.e., mean, signal-to-noise ratio, standard deviation). Response tables can indicate which factor has the largest impact on the response and which level of the factor is related to higher or lower response characteristic values.
- Calculates the selected response characteristic for each factor level combination.
- For each factor, Minitab calculates the average of the response characteristic at each level of the factor. For example, you selected S/N ratios and your design includes factor A, which has 2 levels (1 and 2) and 4 measurements at each level. Minitab calculates the mean of the 4 S/N ratios at level 1 and the mean of the other 4 S/N ratios at level 2.
- For each factor, Minitab calculates the delta value, which is the highest average response characteristic value minus the lowest average response characteristic value for levels of that factor.
- Calculates the rank, which is the order of the delta values from high to low. The factor with the highest delta value is assigned rank 1, the factor with the next highest delta value is assigned rank 2, and so on.
Signal-to-noise ratio for static designs
A signal-to-noise ratio is a measure of robustness, which can be used to identify the control factor settings that minimize the effect of noise on the response. Minitab calculates a separate signal-to-noise (S/N) ratio for each combination of control factor levels in the design. You can choose from different S/N ratios, depending on the goal of your experiment. In all cases, you want to maximize the S/N ratio.
For static designs, Minitab provides four S/N ratios: Smaller is better, Larger is better, and two Nominal is best ratios. You can also choose the adjusted formula for the Nominal is best (II) formula.
Larger is better
The signal-to-noise (S/N) ratio is calculated for each factor level combination. The formula for the larger-is-better S/N ratio using base 10 log is:
S/N = −10*log(Σ(1/Y2)/n)
where Y = responses for the given factor level combination and n = number of responses in the factor level combination.
Smaller is better
The signal-to-noise (S/N) ratio is calculated for each factor level combination. The formula for the smaller-is-better S/N ratio using base 10 log is:
S/N = −10*log(Σ(Y2)/n)
where Y = responses for the given factor level combination and n = number of responses in the factor level combination.
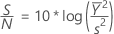
Nominal is best (I)
The signal-to-noise (S/N) ratio is calculated for each factor level combination. The formula for the nominal-is-best (II) S/N ratio using base 10 log is:
You can also choose to use the adjusted formula for the nominal-is-best S/N ratio. The formula is:
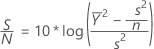
Where:


Nominal is best (II)
The signal-to-noise (S/N) ratio is calculated for each factor level combination. The formula for the nominal-is-best (I) S/N ratio using base 10 log is:
S/N = −10*log(s2)
where s = standard deviation of the responses for all noise factors for the given factor level combination.
Signal-to-noise ratio for dynamic designs
A signal-to-noise ratio is a measure of robustness, which can be used to identify the control factor settings that minimize the effect of noise on the response. Minitab calculates a separate signal-to-noise (S/N) ratio for each combination of control factor levels in the design. You can choose from different S/N ratios, depending on the goal of your experiment. In all cases, you want to maximize the S/N ratio.
For dynamic designs, the S/N ratio is closely related to the nominal-is-best S/N ratio.
Formula
The formula for the signal-to-noise (S/N) ratio for a dynamic Taguchi design using base 10 log is:
S/N = 10*log [(slope)2 / MSE]
where MSE = mean square error
You can also choose to use the adjusted formula of the dynamic signal-to-noise ratio:
S/N = 10*log [(slope2 / MSE) – (1/r)]
where r = Σ(signal – ref)2 and ref = reference signal (if one exists) or mean signal.