Main effects plot
Main effects plots show how each factor affects the response characteristic (S/N ratio, means, slopes, standard deviations). A main effect exists when different levels of a factor affect the characteristic differently. For a factor with two levels, you may discover that one level increases the mean compared to the other level. This difference is a main effect.
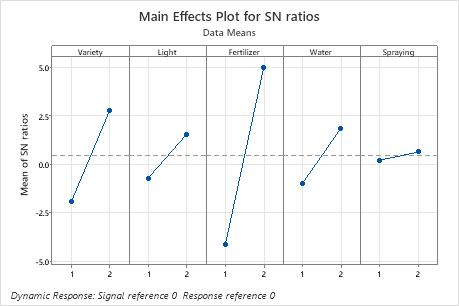
In these results, the main effects plot for S/N ratio indicates that Fertilizer has the largest effect on the signal-to-noise ratio. On average, experimental runs with Fertilizer 2 had much higher signal-to-noise ratios than experimental runs with Fertilizer 1. Spraying had a small effect or no effect on the signal-to-noise ratio.