A response surface design is a set of advanced design of experiments (DOE) techniques that help you better understand and optimize your response. Response surface design methodology is often used to refine models after you have determined important factors using screening designs or factorial designs; especially if you suspect curvature in the response surface.
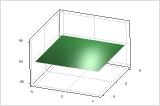
Response surface with no curvature
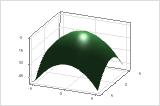
Response surface with curvature
- Understanding or mapping a region of a response surface. Response surface equations model how changes in variables affect a response of interest.
- Finding the levels of variables that optimize a response.
- Selecting the operating conditions to meet specifications.
For example, you would like to determine the best conditions for injection-molding a plastic part. You first used a screening or factorial experiment to determine the significant factors (temperature, pressure, cooling rate). You can use a response surface designed experiment to determine the optimal settings for each factor.
Perform the analysis
- Enter the name of your response variable
- The worksheet includes a column with this name where you enter the data from the experiment.
- Table of factors
- Under Name, enter a descriptive name for each factor.
- Number of replicates
- Enter how many times to perform each experimental run that is in the base design. Usually, you consider the available resources and the purpose of your design when you select the number of replicates. You can add replicates to your design later with . For more information on replicates, go to Replicates and repeats in designed experiments.
Example
A scientist wants to conduct an experiment to maximize crystal growth. Previous research has determined that catalyst exposure time, catalyst percentage, and temperature explain much of the variability in crystal growth.
- Choose .
- Select Select a Three-Factor Design.
- Select Create an experiment with two or three continuous factors. Select OK.
- Select Estimate main, interaction and quadratic effects. Select OK.
- In the new dialog, in Enter the name of your response variable, enter Growth.
- Complete the table with the following settings:
Name Type Low High Catalyst exposure time Continuous 12 36 Catalyst percentage Continuous 2 10 Temperature Continuous 20 45 - In Number of replicates, select None. Select OK.
The design summary table shows that the design has 20 base runs. The worksheet contains the 20 runs in run order, which is random.