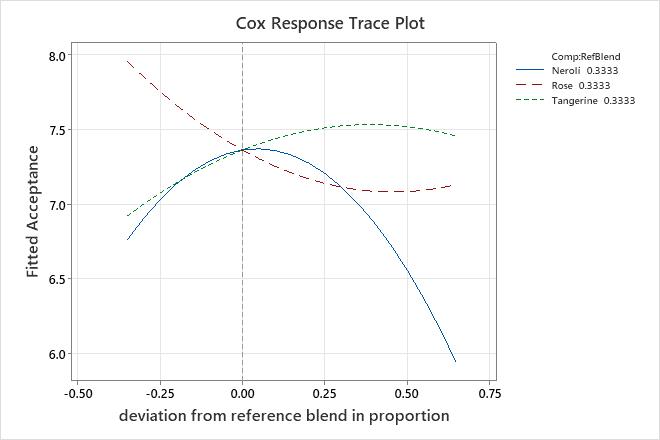
Use a response trace plot to examine the effect of each component on the response. The trace curves show the effect of changing the corresponding component along an imaginary line connecting the reference blend to the vertex. Keep the following in mind when you interpret a response trace plot:
- Interpret all components relative to the reference blend.
- Components with the greatest effect on the response will have the steepest response traces.
- Components with larger ranges (upper bound - lower bound) will have longer response traces; components with smaller ranges will have shorter response traces.
- The total effect of a component depends on both the range of the component and the steepness of its response trace. The total effect is defined as the difference in the response between the effect direction point at which the component is at its upper bound and the effect direction point at which the component is at its lower bound.
- Components with approximately horizontal response traces have virtually no effect on the response.
- Components with similar response traces will have similar effects on the response.

Key Results: Response Trace Plot
In this plot, the reference blend is the centroid of the design vertices; each component represents 0.3333 of the total. The trace plot provides the following information about the component effects when you start at the location that corresponds to the reference blend:
- As the proportion of neroli oil in the mixture either increases or decreases relative to the reference blend, the acceptance rating of the deodorizer decreases. The proportion of neroli oil in the reference blend is near optimal.
- As the proportion of rose oil in the mixture increases, the acceptance rating of the deodorizer decreases slightly. As the proportion decreases, the acceptance rating increases. A decrease in the proportion of rose oil relative to the reference blend may improve the acceptance rating.
- As the proportion of tangerine oil in the mixture increases, the acceptance rating of the deodorizer increases slightly. As the proportion decreases, the acceptance rating decreases. An increase in the proportion of tangerine oil relative to the reference blend may improve the acceptance rating.
