In This Topic
DF
The total degrees of freedom (DF) are the amount of information in your data. The analysis uses that information to estimate the values of the coefficients. The total DF is 1 less than the number of rows in the data. The DF for a term shows how many coefficients that term uses. Increasing the number of terms in your model adds more coefficients to the model, which decreases the DF for error. The DF for error are the remaining degrees of freedom that are not used in the model.
Note
For a 2-level factorial design or a Plackett-Burman design, if a design has center points, then one DF is for the test for curvature. If the term for center points is in the model, the row for curvature is part of the model. If the term for center points is not in the model, the row for curvature is part of the error that is used to test terms that are in the model. In response surface and definitive screening designs, you can estimate square terms, so the test for curvature is unnecessary.
Seq Dev
- Model
- The sequential deviance for the regression model quantifies how much of the total deviance is explained by the model.
- Term
- The sequential deviance for a term quantifies the difference between a model up to and including a particular term, with the term and without the term.
- Error
- The sequential deviance for error quantifies the deviance that the model does not explain.
- Total
- The total sequential deviance is the sum of the sequential deviance for the model and the sequential deviance for error. The total sequential deviance quantifies the total deviance in the data.
Interpretation
When you specify use of the sequential deviance for tests, Minitab uses the sequential deviance to calculate the p-values for the regression model and the individual terms. Usually, you interpret the p-values instead of the sequential deviance.
Contribution
Contribution displays the percentage that each source in the ANOVA table contributes to the total sequential deviance.
Interpretation
Higher percentages indicate that the source accounts for more of the deviance in the response variable. The percent contribution for the regression model is the same as the deviance R2.
Adj Dev
Adjusted deviances are measures of variation for different components of the model. The order of the predictors in the model does not affect the calculation of the adjusted deviances. In the Deviance table, Minitab separates the deviance into different components that describe the deviance explained by different sources.
- Model
- The adjusted deviance for the regression model quantifies the difference between the current model and the constant model.
- Term
- The adjusted deviance for a term quantifies the difference between a model with the term and without the term.
- Error
- The adjusted deviance for error quantifies the deviance that the model does not explain.
- Total
- The total adjusted deviance is the sum of the adjusted deviance for the model and the adjusted deviance for error. The total adjusted deviance quantifies the total deviance in the data.
Interpretation
Minitab uses the adjusted deviances to calculate the p-value for a term. Minitab also uses the adjusted deviances to calculate the deviance R2 statistic. Usually, you interpret the p-values and the R2 statistic instead of the deviances.
Adj Mean
Adjusted mean deviance measures how much deviance a term or a model explains for each degree of freedom. The calculation of the adjusted mean deviance for each term assumes that all other terms are in the model.
Interpretation
Minitab uses the chi-square value to calculate the p-value for a term. Usually, you interpret the p-values instead of the adjusted mean squares.
Chi-Square
Each term in the ANOVA table has a chi-square value. The chi-square value is the test statistic that determines whether a term or model has an association with the response.
Interpretation
Minitab uses the chi-square statistic to calculate the p-value, which you use to make a decision about the statistical significance of the terms and the model. The p-value is a probability that measures the evidence against the null hypothesis. Lower probabilities provide stronger evidence against the null hypothesis. A sufficiently large chi-square statistic results in a small p-value, which indicates that the term or model is statistically significant.
P-value – Model
The p-value is a probability that measures the evidence against the null hypothesis. Lower probabilities provide stronger evidence against the null hypothesis.
Interpretation
- P-value ≤ α: At least one coefficient is different from 0
- If the p-value is less than or equal to the significance level, you conclude that at least one coefficient is different from 0.
- P-value > α: Not enough evidence exists to conclude that at least one coefficient is different from 0
- If the p-value is greater than the significance level, you cannot conclude that at least one coefficient is different from 0. You may want to fit a new model.
The tests in the Deviance table are likelihood ratio tests. The test in the expanded display of the Coefficients table are Wald approximation tests. The likelihood ratio tests are more accurate for small samples than the Wald approximation tests.
P-Value – Term
The p-value is a probability that measures the evidence against the null hypothesis. Lower probabilities provide stronger evidence against the null hypothesis.
Interpretation
- P-value ≤ α: The association is statistically significant
- If the p-value is less than or equal to the significance level, you can conclude that there is a statistically significant association between the response variable and the term.
- P-value > α: The association is not statistically significant
- If the p-value is greater than the significance level, you cannot conclude that there is a statistically significant association between the response variable and the term. You may want to refit the model without the term.
- If a continuous factor is significant, you can conclude that the coefficient for the factor is different from zero.
- If a categorical factor is significant, you can conclude that the probability of the event is not the same for all levels of the factor.
- If an interaction term is significant, you can conclude that the relationship between a factor and the probability of the event depends on the other factors in the term.
- If a quadratic term is significant, you can conclude that the response surface features curvature.
The tests in the Analysis of variance table are likelihood ratio tests. The test in the expanded display of the Coefficients table are Wald approximation tests. The likelihood ratio tests are more accurate for small samples than the Wald approximation tests.
P-value – Curvature
The p-value is a probability that measures the evidence against the null hypothesis. Lower probabilities provide stronger evidence against the null hypothesis.
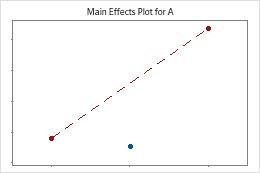
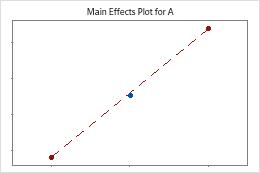
Minitab tests for curvature when the design has center points. The test looks at the fitted mean of the response at the center points relative to the expected mean if the relationships between the model terms and the response are linear. To visualize the curvature, use factorial plots.

The center points are far away from the line that joins the means of the corner points, which suggests a curved relationship. Use the p-value to verify that the curvature is statistically significant.

The center points are near the line that joins the means of the corner points. The curvature is probably not statistically significant.
Interpretation
To determine whether at least one of the factors have a curved relationship with the response, compare the p-value for curvature to your significance level to assess the null hypothesis. The null hypothesis is that all the relationships between the factors and the response are linear.
Usually, a significance level (denoted as α or alpha) of 0.05 works well. A significance level of 0.05 indicates a 5% risk of concluding that different conditions between runs change the response when the conditions do not.
- P-value ≤ α: At least one factor has a curved relationship with the response
- If the p-value is less than or equal to the significance level, you conclude that at least one of the factors has a curved relationship with the response. You may want to add axial points to the design so that you can model the curvature.
- P-value > α: There is not enough evidence to conclude that any factors have a curved relationship with the response
- If the p-value is greater than the significance level, you cannot conclude that any of the factors have a curved relationship with the response. If the curvature is part of the model, you may want to refit the model without a term for center points so that the curvature is part of the error.
Note
Usually, if the curvature is not statistically significant, you remove the center point term. If you leave the center points in the model, Minitab assumes that the model contains curvature that the factorial design cannot fit. Due to the inadequate fit, Contour Plot, Surface Plot, and Overlaid Contour Plot are not available. Also, Minitab does not interpolate between the factor levels in the design with Response Optimizer. For more information on ways to use the model, go to Stored model overview.
