What is MANOVA (multivariate analysis of variance)?
- Increased power
- You can use the covariance structure of the data between the response variables to test the equality of means at the same time. If the response variables are correlated, then this additional information can help detect differences too small to be detected through individual ANOVAs.
- Detects multivariate response patterns
- The factors may affect the relationship between responses instead of affecting a single response. ANOVAs will not detect these multivariate patterns as the following figures show.
- Controls the family error rate
- Your chance of incorrectly rejecting the null hypothesis increases with each successive ANOVA. Doing one MANOVA to test all response variables at the same time keeps the family error rate equal to your alpha level.
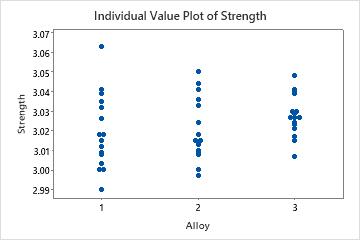
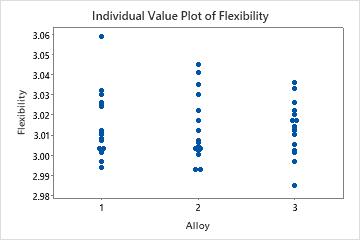
For example, you are studying the affects of different alloys (1, 2, and 3) on the strength and flexibility of your company's building products. You first perform two separate ANOVAs but the results are not significant. Surprised, you plot the raw data for both response variables using individual value plots. These plots visually confirm the insignificant ANOVA results.


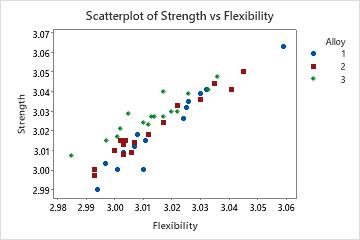
Because the response variables are correlated, you perform a MANOVA. This time the results are significant with p-values less than 0.05. You create a scatterplot to better understand the results.

The individual value plots show, from a univariate perspective, that the alloys do not significantly affect either strength or flexibility. However, the scatterplot of the same data shows that the different alloys change the relationship between the two response variables. That is, for a specified flexibility score, Alloy 3 usually has a higher strength score than Alloys 1 and 2. MANOVA can detect this type of multivariate response whereas ANOVA cannot.
Note
Usually, you should graph the data before conducting any analyses because it will help you decide what approach is appropriate.
Which multivariate tests are included in MANOVA?
- Wilk's test
- Lawley-Hotelling test
- Pillai's test
- Roy's largest root test
- An H (hypothesis) matrix associated with each term; also called between sample sums of squares
- An E (error) matrix associated with the error for the test; also called within sample sums of squares
The SSCP matrices are displayed when you request the hypothesis matrices.
You can express the test statistics either as H, E, or H and E, or as the eigenvalues of E-1 H. You can request to have these eigenvalues displayed. (If the eigenvalues are repeated, corresponding eigenvectors are not unique and in this case, the eigenvectors Minitab displays and those in books or other software may not agree. The MANOVA tests, however, are always unique.)
