Specify a log transformation and whether you want Minitab to display the same Y-scale for
multiple charts.
Log transformation
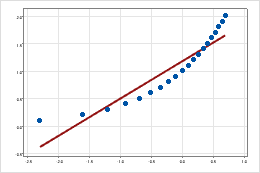
A logarithmic scale linearizes logarithmic relationships by changing the axis, so
that the same distance represents different changes in value across the scale. For
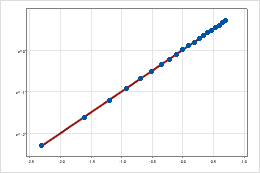
example, in the scatterplot with the untransformed Y-scale, the function is not
linear. When you transform the Y-scale to logarithm base e, the form of the data is
linear.