In This Topic
Step 1: Compare data points to the line on the symmetry plot
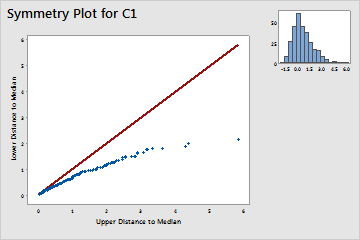
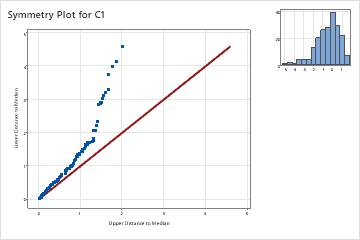
Compare the data points to the reference line to assess the degree of symmetry present in your data. The more symmetric the data, the closer the points will be to the line. Even with normally distributed data, you can expect to see runs of points above or below the line. Notice whether the points remain close to or parallel to the line, or whether they diverge from the line. Points that diverge from the line indicate asymmetric data. Asymmetric data are either right-skewed or left-skewed.
Minitab plots the distance from the median of points greater than the median against the corresponding points that are less than the median. The distance for each pair are the x- and y-coordinates of a single point. Data that follow a symmetric distribution fall along the 45° reference line, Y=X, in a symmetry plot.
- Right-skewed data
- Data points that diverge below the line indicate skewness to the right.
- Left-skewed data
- Data points that diverge above the line indicate skewness to the left.
Step 2: Examine the distribution on the histogram
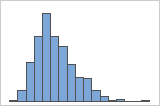
- Right-skewed data (positive-skewed distribution)
- Right-skewed data (also called positive-skewed data) is so named because the "tail" of the distribution points to the right, and because its skewness value is greater than 0 (or positive). The histogram with right-skewed data shows wait times. Most of the wait times are relatively short, and only a few wait times are long.
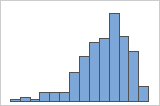
- Left-skewed data (negative-skewed distribution)
- Left-skewed data (also called negative-skewed data) is so named because the "tail" of the distribution points to the left, and because its skewness value is less than 0 (or negative). The histogram with left-skewed data shows failure times. A few items fail immediately, and many more items fail later.


