Step 1: Examine the order of the bars
A Pareto chart is a bar chart in which the bars are ordered from highest frequency of occurrence to lowest frequency of occurrence. Use a Pareto chart to rank your defects from largest to smallest, so that you can prioritize quality improvement efforts.
After a specified percentage of the defectives are categorized, usually 95%, Minitab combines the remaining defects into a group called "Other". The Other category is always displayed as the last bar, even if the Other category has a higher count than previous categories.
Key Results: Counts, Percent
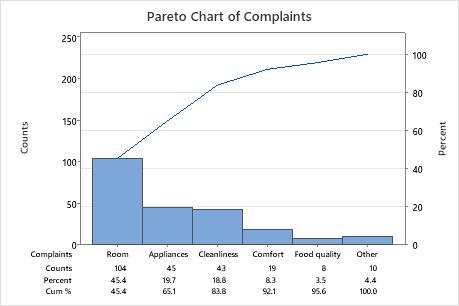
In these results, the largest source of complaints is from Room. The chart shows 104 complaints about rooms, which account for 45.4% of all the complaints.
Step 2: Examine the cumulative percentage line
The cumulative percentage line starts at the first (highest) bar, and extends to the last bar to help you assess the added contribution of each category. The cumulative percentage is also displayed for each bar under the chart unless you have a by variable and display all on one graph.
Key Results: Cum %
In these results, 65.1% of all the complaints are from the first two categories, Room and Appliances. Over 90% of all complaints are from the first 4 categories.